Blue Mountains ‘City’ Council’s heritage hypocrisy persists
Tuesday, December 23rd, 2025Blue Mountains ‘City’ Council’s development approval process is organisation-wide, culturally mealy-mouthed and corrupted from one’s learned personal experience since 2001 and of records well prior, indeed since 1957 from damning local accounts.
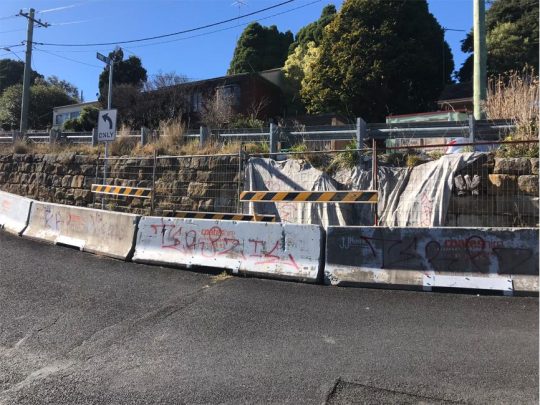
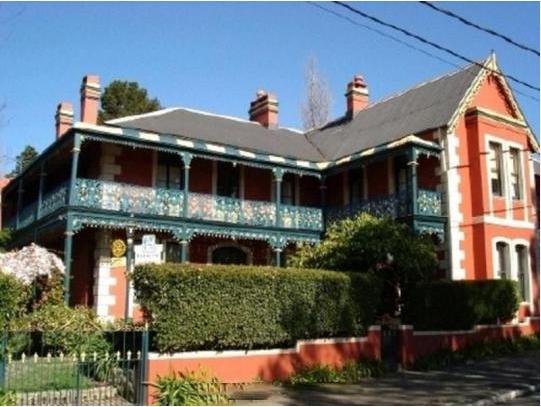
Heritage Katoomba – intersection of Cascade and Pine Streets. Council neglect of The Gully Catchment is systemic. This 19th Century heritage streetscape has been ignored for decades by Blue Mountains (City) Council with its city-centric mindset, hateful of our colonial heritage. [Photo: By author June 2024].
PART I. A Land-Use Development issue at hand
We highlight a non-complying third outbuilding development by an immediate neighbour (being a current work in progress in December 2025) located in a low density residential zoned and heritage listed area of Katoomba in the Blue Mountains. Verbal feedback is that it is set to become a new ‘backyard sauna‘ situated just 30cm from this author’s back fence boundary, yet our research shows that the build is prohibited under various local Council and Sydney Water planning rules.
Post build, the currently owner-occupied residential property (with renovated dwelling) is, news to hand, now intended to be let out to online Airbnb-type tourists for likely tourist group parties. Include also the likes of online holiday let ‘Stayz’, ‘Bookings.com’, etc. It will thus far become number 13 holiday let of a owner occupied residential house and land property within a recent trend of invading gourmet Airbnb-profiting investment owners in this heritage residential only conservation area.’
An intro heads up: Check out this and the pricing: ^https://holidaybluemountains.com/properties/
This regrettably sanctioned ‘blind-eyed’ allowance by local Council continues to undermine and engulf our quiet heritage listed residential cul-de-sac (where we’ve owned and lived as a small family since 2001). Our century-old home, which we are ongoing restoring in heritage sympathy with colonial cottages around us is listed as 1883 ‘North’s Estate’.
One serious concern is that local tenants, once prominent in this precinct have simply been priced out of available rental accommodation by greedy distant investors of residential properties around us on the band wagon of holiday letting their residential properties for many times the rental market average. Local tenants have nowhere to go but to relocate far flung from family way afar. Indeed, its sad and bad times, all encouraged by government failure and lack of interest in their constituents and all three levels of Australian government – federal, state and local!
An unnotified, unapproved new backyard sauna right on our back fence to be part of a new Airbnb for guests to party. WTF!
A case in point is an ongoing current over-development/overcrowding of a residential property In Katoomba situated close by us, situated within a designated heritage (historical) conservation area. It is in breach of many Council development rules. Yet, despite our expressed concerns, citing of legislative breaches (ignored), then our submitted complaint, Council has just turned a blind eye and wipes its hands, citing NSW state legislation supposed exempting legislation. Council’s attitude, by some blow-in inspector from Sydney, is that property owners may do what they bloody well want, heritage be damned, neighbours be damned!
As a Conservation Consultant, this little black duck didn’t come down in the last shower!
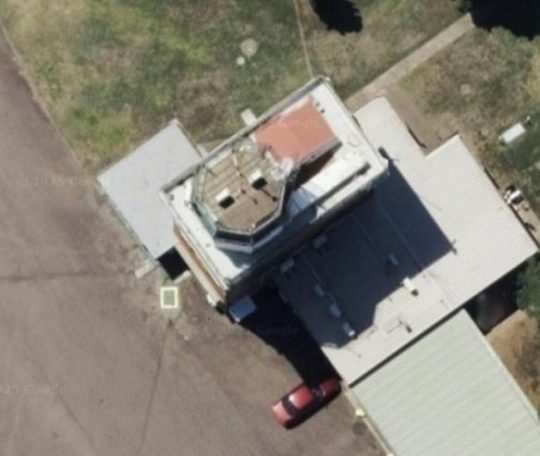
This is a non-public photo of the subject property, only to demonstrate the reality anonymously. It is situated somewhere within a listed heritage conservation area and there exist multiple ‘rules’ regarding development for this area and this address.
Firstly we know, because firstly we have ourselves gone through the property development rules, guidelines, red tape restrictions, respecting where we are, sensitive to the heritage amenity and to our neighbours. We eventually succeeded in having our plans approved by Council way back in 2005 after much effort, research and personal cost. Our renovation project is both a sympathetic restoration and quality classic home improvement to the long neglected cottage we purchased back in 2000.
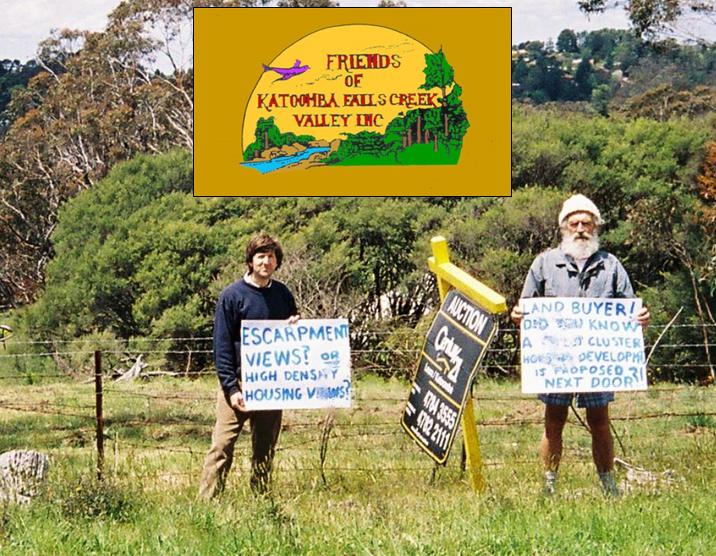
Secondly, Steven Ridd, this joint owner has spent many years since 2001 as a environmental/conservation activist initially with The Friends of Katoomba Falls Creek Valley Inc., The Blue Mountains Conservation Society, The Colong Foundation for Wilderness Inc., and The Habitat Advocate – ongoing here since 2001.
PART II. Disclaimer
(1) This article herein expresses the concerns of this author.
(2) This article is yes, political.
(3) The views, assumptions and opinions expressed in this article are the author(s) own. They do not purport to reflect the official policy of The Habitat Advocate or associates. Data references (images, documents, links, copyright, sources, etc.) appearing in this article are not necessarily controlled or monitored by The Habitat Advocate.
(4) The information provided on this [Website/in this Article/Document] is for general informational purposes only.
(5) This article and its author hold absolutely no malice towards the example property developer which is anonymously used in this article simply to highlight the ongoing systemic failures of the Blue Mountains local government to respect local heritage conservation.
(6) This article is purely intended as a critical commentary on the injustice of due process, using this property development example as a sample case study only. The property owner is irrelevant, rather it is about the failure of due process.
(7) All information is provided in good faith for informational purposes only. This article is not a guide or advice. It is citizen journalism. We make no representation or warranty of any kind, express or implied, regarding the accuracy, adequacy, validity, reliability, availability, or completeness of any information provided.
(8) Under no circumstance shall we have accept any liability to any reader for any loss or damage of any kind incurred as a result of the use of the [site/article/document] or reliance on any information provided therein. A reader’s use of the [site/article/document] and/or reliance on any information is solely at the reader’s own risk. This article is citizen journalism.
(9) The [site/article/document] cannot and does not contain [medical/legal/financial/etc.] advice. The information is provided for general informational and educational purposes only and is not a substitute for professional advice. Accordingly, before taking any actions based on such information, we encourage any reader to consult with the appropriate professionals. The use or reliance of any information contained in this [site/article/document] is solely at a reader’s own risk.
(10) Due privacy is respected in this article. No identifying information is provided in this article about the property or the owner which a member of the general public could recognise in any text or images included in this article. However, we do photograph the builder – Wayne, and identify the Council inspector, both of whom have ignored all the development rules and need to be held accountable.
(11) The purpose of this article is not about any individual property owner, but to critique and challenged an example the systemic wrong/illegal land use development approval process by Blue Mountains (City) Council over many years, and is clearly ongoing.
This author, The Habitat Advocate’s founder, Conservation Consultant, Steven Ridd.
PART III. Issue Background
So, how does Blue Mountains ‘City’ Council’s heritage hypocrisy persist?
Well, here’s an extract map of part of North’s Estate Conservation Area in Katoomba dating back to 1883, as registered by Council, yet only on paper for starters since Council’s filed it for a decade:
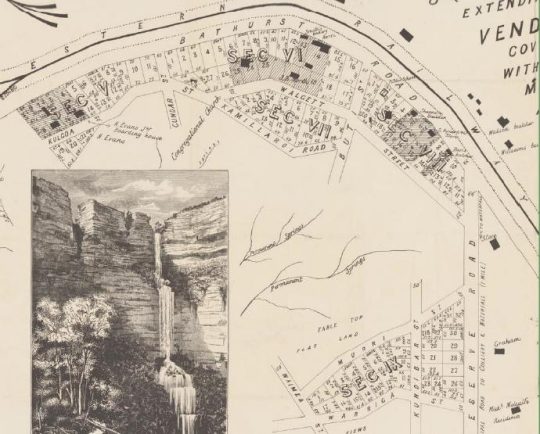
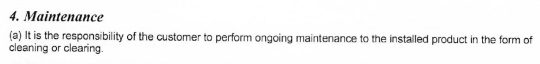
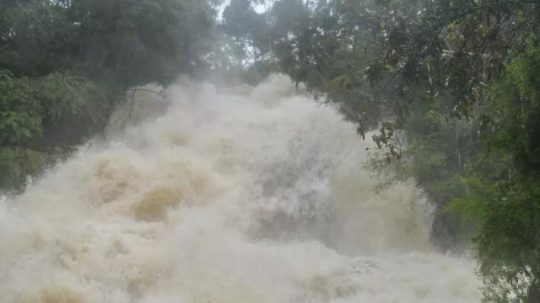
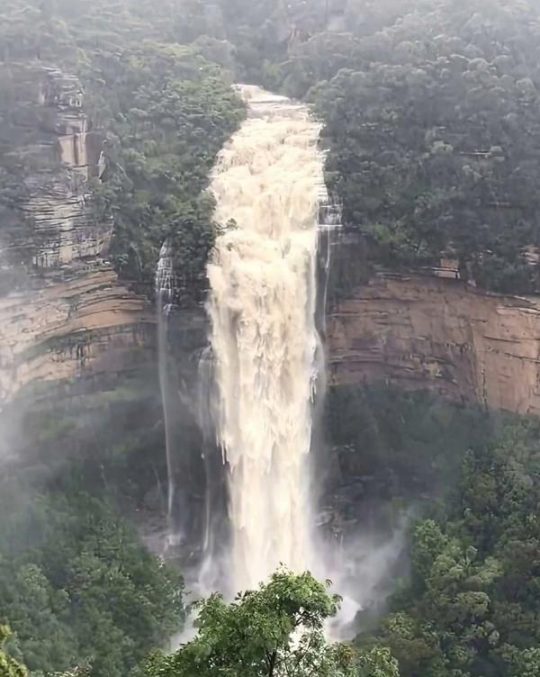
‘North’s Estate’ – quote: just two? housing subdivision precincts (north and south) skirting the valley in between back in 1883. No! Try nine sections. This is a portion of the fully image/reality. It was no less used by Blue Mountains Council’s ignorant ring-in ‘heritage’ consultants from distant Sydney. [AUTHOR’S NOTE: An ‘artist’s impression of Katoomba Falls (in full flood) insert. The above Airbnb dwelling is within SEC IX.]
Council’s repeated actions fail to comply with its very own policies, planning documents, bi-laws, and PR gestures.
That this local government Council (‘BMCC’ acronym) patting itself on the back about in its quarterly community newsletter is blatant propaganda about all the so-called good it is doing for the Blue Mountains – its oxymoronic slogan “A City within a World Heritage Area” boasted claim.
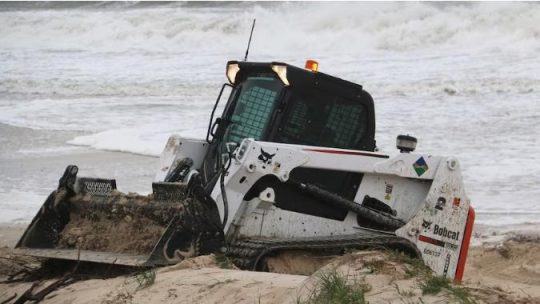
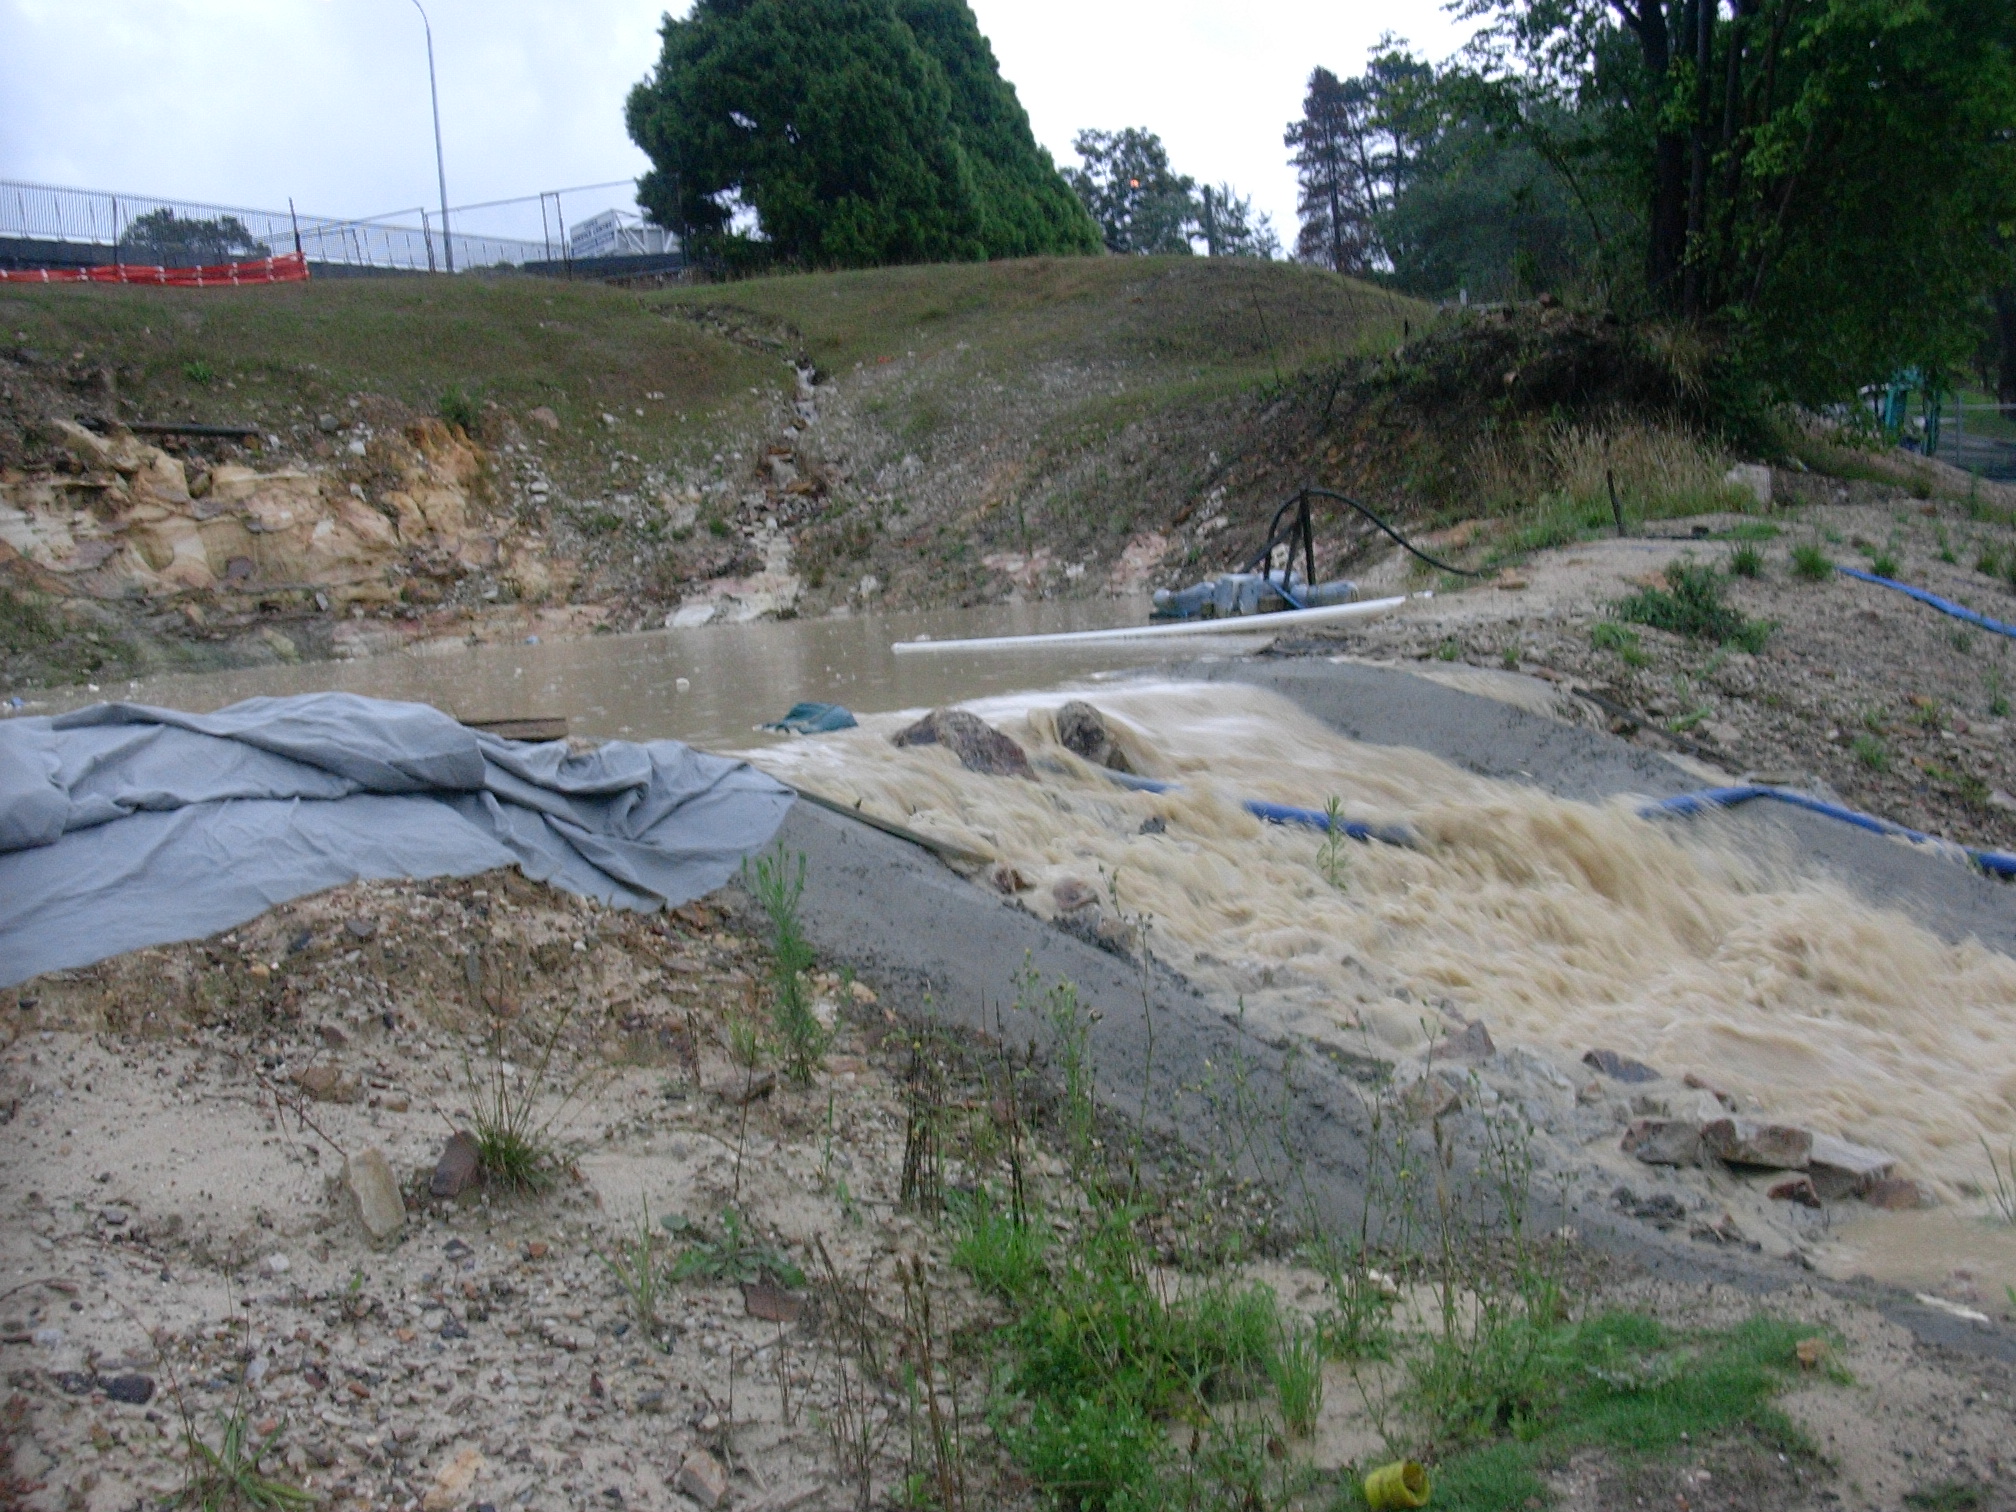
Yeah? Like how all its stormwater and unbunded rubbish waste tips (Blackheath | Katoomba | Blaxland) up on the plateau tops seep their toxic effluent into the surrounding groundwater to watercourses and water catchments through World Heritage?
Check the mapping. Council’s Katoomba Tip (with a fancy name), situated on a ridgetop off Woodlands Road, has for decades received household garbage and an array of toxic contaminants that have been allowed to seep into the ground water and down into nearby Yosemite Creek, over Minnehaha Falls (and swimming hole) thence downstream into Katoomba Creek, Govetts Creek and into the Grose River through World Heritage. It is therefore not a wise move to swim in that swimming hole.
The same has been allowed at Council’s Blaxland Tip to contaminate adjacent Cripple Creek (appropriately named in hindsight), thence into Fitzgeralds Creek and into the Nepean River. Similarly, it is therefore also not a wise move to swim at Penrith Beach adjacent.
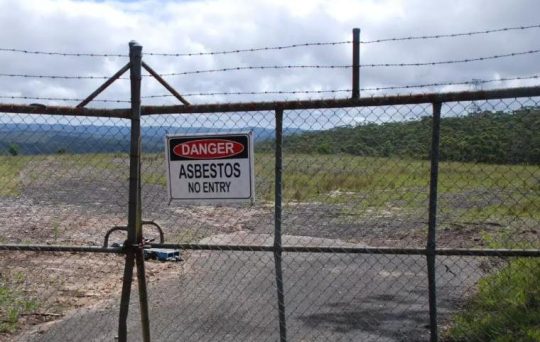
Council’s old Blackheath Tip on Ridgewell Road closed and fenced off since November 2017 due to illegal asbestos dumping. The garbage and contaminants dumped there over decades have been allows to seep toxic waste into Victoria Creek below which flows into the Grose River within the Blue Mountains World heritage Area. To date the site remains unremediated by Council.
And yeah? Like how its five public swimming pools (all chlorine saturated) respectively at Blackheath, Katoomba, Lawson, Springwood and Glenbrook each drain their entire contents each winter into the surrounding watercourses. So is that why all the native aquatic wildlife (fish, eels, freshwater crayfish and macro-invertebrates) – no longer subsist in the Blue Mountains World Heritage creeks and rivers downstream?
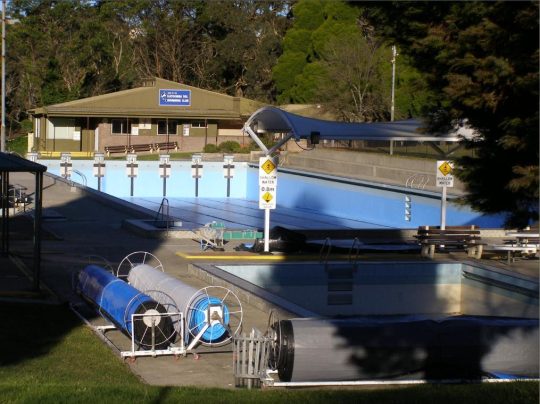
Council’s Katoomba Aquatic Centre 50 metre Olympic pool. Since first opening in 1972, it’s 2.5 million litres get drained not into the sewer system, but into the adjoining Catalina dam every winter which then drains into the adjoining creek. That creek Katoomba Falls Creek flows over Katoomba Falls (1km south) which feeds Kedumba River through the Blue Mountains World Heritage Area and supplies Sydney’s drinking water in the dammed Lake Burragorang. No wonder many Sydneysiders choose bottled water. This is just one of five Council swimming pools which all do this.
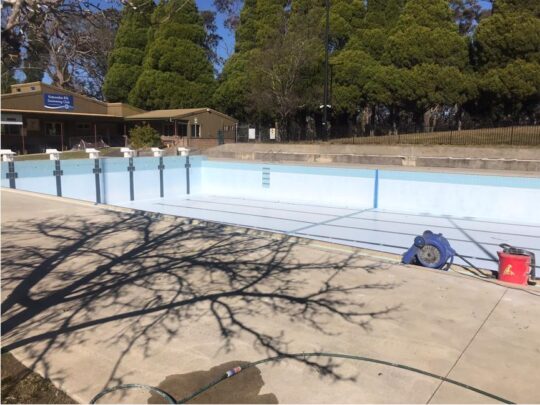
Blue Mountains Council’s olympic pool at Katoomba again the entire chorinated contents drained into the downstream Kedumba River water catchment within the Blue Mountins World Heritage Area. It happens every winter since 1972. (Photo by editor 2026-07-13).
Long dead are all downstream creeks and the Kedumba and Grose Rivers of our World Heritage Blue Mountains. Why are we still “World Heritage” listed with UNESCO if it’s just a political ruse to fuel a megalopolis snowballing Sydney’s drinking water supply? Labor’s former Member for Blue Mountains Bob Debus never answered that question. I wouldn’t drink the stuff, well knowing what goes downstream into Lake Burragorang above Sydney’s survival Warragamba Dam.
Council in its aloof chambers perched in a high rise away from the Katoomba community has thought of itself as running a “city” moreso than a regional municipality well beyond the big city high-rise and sprawl that is the metropolitan city of Sydney. Most councillors, management, staff (the ‘Council mob’) and of course the plethora of senior management’s ring-in consultants have emanated from Sydney, muchly with an urban big city mindset.
Quote: “Suburbs“? So is NSW Tibooburra a quote “suburb” as well? Wikipedia: “Tibooburra is a town in the far northwest of New South Wales, Australia, located 1,187 kilometres (738 mi) from the state capital, Sydney.” [read more]
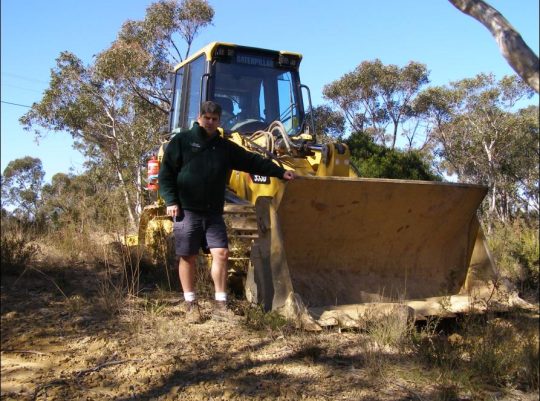
We suggest Australia’s own remote village of Tibooburra (shown here) replaces the otherwise politically-correct “sister cities” of the Blue Mountains Council – currently being exotic Sanda City (Japan) and Flagstaff (Arizona, USA). Outback Tibooburra would well save local Blue Mountains ratepayer funded councillors rorting the ‘sister city’ con on business class flights to both. We can’t image the elite councillors swapping business class exotic perks for Aussie outback reality! Hey they could claim Tibooburra as a Climate Change inspection trip!
Katoomba, for those not familiar, is not yet a suburb of megalopolis Sydney. It’s just an equivalent well distant remote village like that of Shelby in Montana, USA ain’t yet a suburb of New York City! [read more about Shelby]
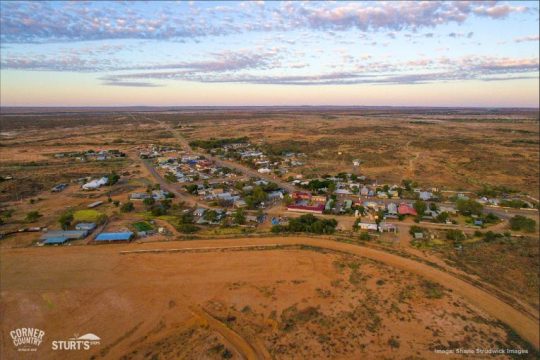
Meanwhile, property investors across Australia are cashing in with Airbnb outsourcing and the NSW Government lets ’em… Check this in this subject area of North’s Estate Conservation Area in regional Katoomba, which confirms no tourist accommodation exists. Crap! … Try more that 500 Airbnbs taking over the regional Blue Mountains !!! Here’s an example…
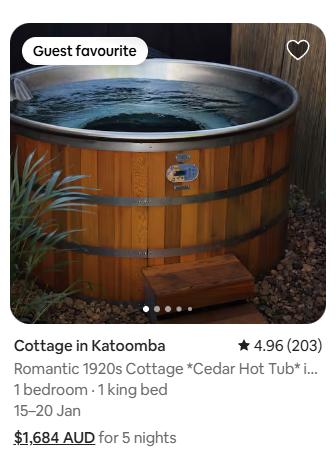
This nearby sample local two-bedroom cottage investment has two income options: (A) Market median rental at $650/week, plus Plus ulility expenses of course – electricity, gas, water. Else (B) Airbnb at $2357/week (calc: being $1684 x 7/5) – so approaching 4 times the rental income! So instead of charging rent equating to around $100 per day, try close to $330 per day! The holiday let market (Airbnb, Stayz, Bookings.com) in New South Wales is unregulated. Such has been allowed to become a housing unaffordable pandemic – wealthy baby boomers denying local young renters in favour of more lucrative wealthy fly-by tourists, mostly from overseas. Dare we term it ‘Wham, bam, thank you, ma’am’ housing. Government politicians do similar – like own multiple properties on the investment bandwagon. [Source: Airbnb]
“The average rent for a house in the Blue Mountains is around $600 – $650+ per week, with specific suburbs varying, but showing strong demand and low vacancy rates, meaning it’s a tight rental market with prices generally trending up, especially for larger homes“.
[Source: Google AI (2025) – so anonymous, so frankly who knows the truth online these days.]
Sydney is far from being an ideal city, so not an appropriate role model for any regional community. The Blue Mountains village of Leura would be a far better role model, but visitors note, the streetscape and garden plantings down Leura Mall are not the work of Council, but rather by volunteer efforts and funding by local Leura residents and Leura small retailers.
Whereas, Council loathes knowledgeable long-time locals because ex-Sydney council staff are blow-ins reaping self-interest paychecks. Council prevails in its bubble mindset in ‘north Katoomba’ conjured up tarting up the footpath in nearby Katoomba and Bathurst Streets (‘south’ Katoomba). That brain snap cost $3 million and did squat. Of course Council outsourced it to some Sydney contractor again. But it directly shut down many retailers retail for nearly a year causing many to go broke. Nice one, lower Mountains Mayor Mark Greenhill!
More recently, self-anointed Blue Mountains councillors (100% Labor Party obedient disciples) have ramped up the ‘ECO’ zealotry thus…
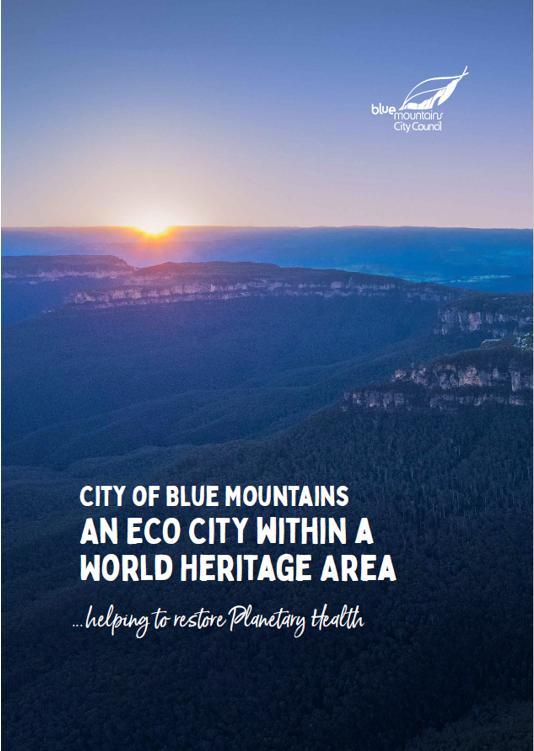
“Eco City”? “Planetary Health”?
Pull the other one, Council!
This Council mob continues to remain aloof to the interests of locals and chronically blasé in attitude to respecting local Mountains heritage in all its genres. The bureaucrats are so overpaid (out of local ratepayer rates and their NSW Labor mates’ NSW government grants) and so happily unaccountable, especially the higher echelons to a salary of $300,000+ per year. Where’s the helicopter and helipad to fly in Council’s GM’s ring-in commute from Sydney to Katoomba chambers to show up for the odd (“yeah, we need you”) meeting?
As a long-time resident of the Blue Mountains region west of Sydney, The Habitat Advocate (read about us) has become accustomed with this local council’s ongoing contempt for heritage. Heritage conservation in all its genres – natural/environmental, historical, built/architectural, village streetscape, Aboriginal, you name it.
A case in point is comparing the ground-truthing reality with Council’s webpage entitled ‘Heritage Conservation Areas’ (Go to this link and read: ^https://www.bmcc.nsw.gov.au/heritage/heritage-conservation-areas).
The spiel starts off as follows:
“The Blue Mountains is well-known for the historic character of many of its towns and villages. In some towns and neighbourhoods buildings from the Victorian, Federation, Edwardian, Inter-War and Post-War eras create visually interesting and layered streetscapes. Many streetscapes are enhanced by mature street tree plantings and established exotic gardens.
Council has established ongoing recognition and protection for the many early houses and the generally traditional streetscapes found in most towns and villages of the Blue Mountains. These important historic areas are protected as heritage conservation areas. The full list of heritage conservation areas is listed in Schedule 5 of the Blue Mountains Local Environmental Plan 2015 (LEP).
The boundary and inclusions for each heritage conservation area are defined by an accompanying map, and the reasons for listing explained in the heritage inventory sheet for each area.
On 19 July 2019, areas of older housing, formerly protected as Period Housing Areas, were converted to new heritage conservation areas as part of Amendment 6 to LEP 2015. Subsequently, the Period Housing provisions of the LEP were superseded by Clause 5.10 of LEP 2015. Full details and timelines from start to finish on this planning proposal are under ‘related sites’.”
‘Propaganda‘ is generally defined as “information, especially of a biased or misleading nature, used to promote a particular cause, doctrine, or point of view.” That is what the above extract is – Council propaganda. Council says one thing yet does another. Council is hypocritical.
Blue Mountains Heritage ‘knowledge’ does NOT reside with Council management and staff
So, why do Blue Mountains councillors seek out Sydneysiders as consultants so repeatedly? Political links? Favours? Bias? Corrupt conduct? All the above? It is because the management are culturally fearful that by Council staff learning such skills, that the Council staff will gain more knowledge that the management. So by Council management engaging distant contractors for one off research tasks, at ratepayers expense of course (else funded out of NSW Government grants) the management incumbent management cannot be replaced by more knowledgeable and competent staff. Jobs for life. Like, Council’s General Manager Dr Rosemary Dillon (not a medical doctor, and elevated in government to corporatised ‘Chief Executive Officer’) has been on management for 30 years, and now gets paid $421,535 per year. Australia’s prime Minister gets $622,000 per year.
We note the tabulated list of these branded ‘Heritage Conservation Areas‘ and surprised to note that these are grouped under the tabulated heading of “Villages”. Good! This is correct! It is in contrast to many amongst the Council mob (ex-Sydney) terming the villages as “suburbs” as if the Blue Mountains is a city. It is that city-centric mindset being propagated to the Mountains locals.
We focus specifically herein on Katoomba’s ‘North’s Estate‘ listing midway down the table. By then clicking on that table’s Map and Inventory Sheet hyperlink ‘K171‘ for North’s Estate, one is directed to another Council webpage to enable one to download a PDF document. The full name of the North’s Estate “item” is ‘North’s Estate Heritage Conservation Area‘ (Local ID: K171). That document is eleven pages long in PDF and we supply a copy link, since it is in the public domain.
 Loading...
[SOURCES: Not Blue Mountains own, but yet again more of Council’s outsourced ring-in consultants from Sydney – the likes of:
-
- Paul Davies Heritage Architects Pty Ltd (of Drummoyne, Sydney)
- (Robyn) Conroy Heritage Planning (of Surry Hills, Sydney)
- Croft & Associates Pty Ltd (of Baulkham Hills, Sydney)
- Meredith Walker (of Rockdale?, Sydney),
- Tropman &Tropman Architects, of 55 Lower Fort St, The Rocks, Sydney.
Blue Mountains Council’s heritage knowledge resides not within its management nor staff. Over the years as long-time employees leave or are asked to leave, no-idea ring-ins typically escaping Sydney take on responsible roles such as in heritage yet with no local knowledge and no handover nor training. It’s like Council’s new recruit orientation going like this: “Welcome aboard, there’s your seat and your shared desk, any questions?” Indeed, we know of one of its legendary former employees Local Studies Librarian and Blue Mountains local historian, Mr John Low OAM who got ‘retired’ way too early by Council management in 2007.
“John Low was Local Studies Librarian at the Blue Mountains City Library 1982-2007. [Note: some 25 years] An active member of the Blue Mountains Historical Society, he received an Order of Australia Medal (OAM) in 2012.”
John had more local knowledge about Blue Mountains history than anyone else at Council. John has over the years written history books on the Blue Mountains and has delivered public presentations on various topics of Blue Mountains history. He researched and prepared a history of this author’s house and street back in 2001. Along with John Low, John Merriman has served as senior staff (but not management) on the Council payroll for almost as long, acquiring details and extensive knowledge and insights into Blue Mountains heritage, particularly its history back to the first colonial crossing of 1813 and prior. Like John Low, John Merriman is also an established author of Blue Mountains history, having written many books and academic papers and published online.
However, Mr Merriman has, instead of being duly promoted for his ability, dedication and long service to say Heritage Manager, he has been relegated from his history office in heritage-listed Braemar House (c.1890 guesthouse) to a basement desk in a corridor below the new Springwood Library, more inaccessible to the public for research, as he was previously. In 2024 the interior of the house was re-purposed as an art gallery featuring local visual art throughout the rooms.
Previously, during the 1980s – 2000s period, both John’s (whom this author knows well) worked under the guidance of Council’s qualified heritage architect Christo Aitken. Mr Aitken probably has more details heritage architecture experience on Council (management and staff). Alas, he was made part-time back in the early 2000s (Council senior management politics again?). So he has since set up his own heritage advisory firm consulting back to Council.
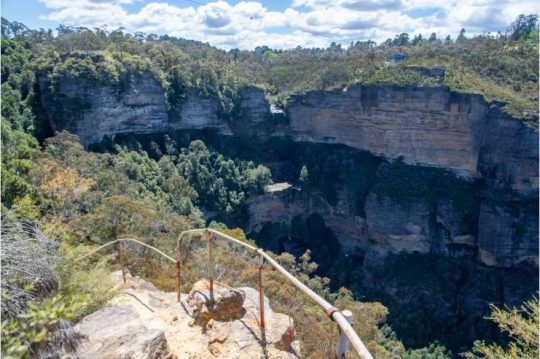
The only ones on Blue Mountains Council these days with heritage knowledge are young ring-ins from Sydney, with no local knowledge or experience – (not their fault per se) but its just as senior management wish to ensure. It’s of course so senior management can maintain a disproportionate power and influence on Council to safeguard their self-interests. Crikies, cynically Council’s heritage strategy and heritage constraints if duly respected and followed could stymie Council’s city-centric development projects, like Council’s Katoomba Falls Kiosk “revitalisation project” of 2019. Check these photos:
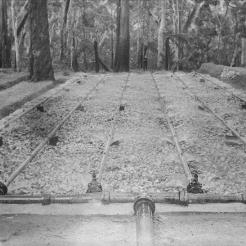
An original photo during construction back in 1921:
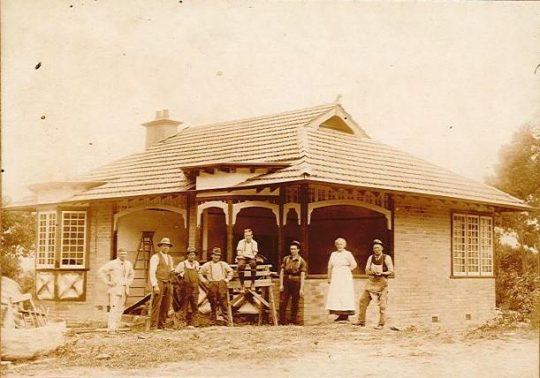
Katoomba Falls Kiosk (owned wholly by Council and heritage listed, Ref. K059)
Yet, Blue Mountains CITY Council’s anti-heritage replacement plan of 2019:
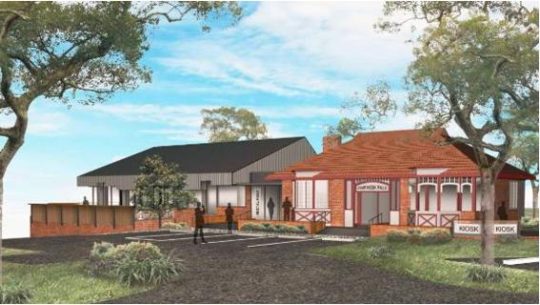
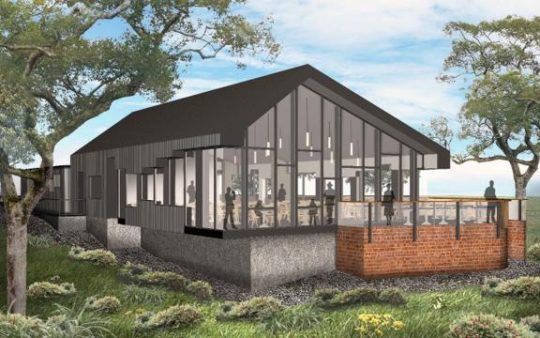
Council’s destructive design for Katoomba Falls Kiosk was rejected by the local Blue Mountains community heritage panel.
[AUTHOR’S NOTE: We recommend that Council assess the bushland site and remove the long closed and dilapidated toilet block near the escarpment edge below the kiosk; it’s overgrown by noxious covered in weeds. Then to and undertake weed removal and bushcare to restore the native vegetation (with an aesthetic fire barrier – use Conservation Hut as a model amenity outcome].This author went for a job on Council once, being a naïve new Blue Mountains resident (from Melbourne) in 2001. In the author’s view the interview process was corrupt and underhand.
The reason why we are writing this article is to cite yet again another example of Blue Mountains Council’s city-centric organisational culture of ignoring and acting contrary to its own policies, planning, rules particularly as they related to Blue Mountains heritage respect, conservation and sympathetic restoration. This deals with a land use development within North’s Estate Heritage Conservation Area (Local ID: K171).
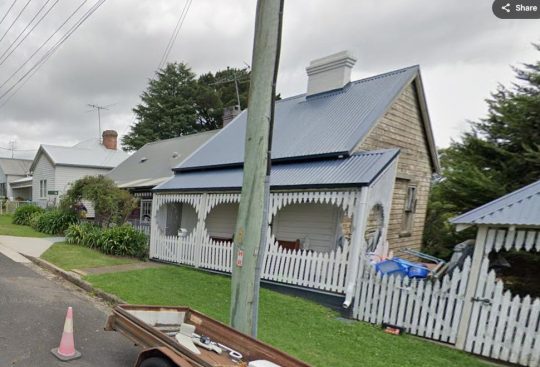
A sample of the heritage housing of North’s Estate.
This article’s writer, and The Habitat Advocate’s founder and Conservation Consultant, Steven Ridd, continues to be based in residence within the North’s Estate Heritage Conservation Area since 2001.
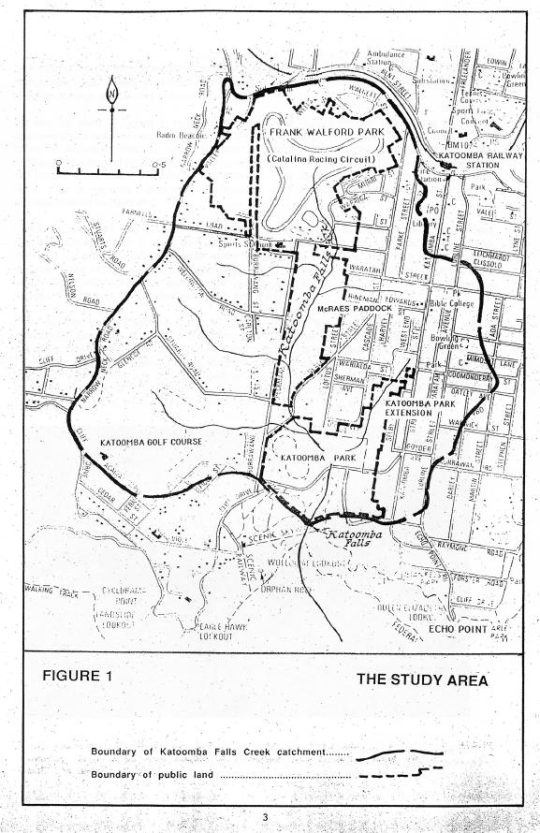
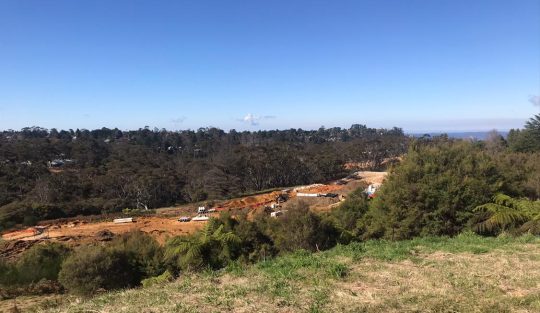
This area is also within what we refer to as ‘The Gully Water Catchment‘, otherwise more broadly known as Katoomba Falls Creek Valley for many decades. Within this catchment is the small natural bushland valley, termed ‘The Gully Aboriginal Place‘. In recognition that many locals (immediate locals) will not know or even be aware the specific location we are to focus upon, for introductory reference, given that we reach a wide audience, for clarity we supply the following maps zoom-in sequence to identify where we are:
PART IV. Topic Location
[AUTHOR’S NOTE: The ‘Issue‘ in this article is about Blue Mountains Council hypocritical treatment of heritage value of the Blue Mountains, in this case historical built heritage and colonial streetscape. The specific ‘Topic‘ within this issue in this article is ‘North’s Estate Heritage Conservation Area’. And then a specific ‘Case in Point‘ is the example of a current ongoing illegal and unapproved ‘backyard sauna‘ development that breaches many rules – heritage, zoning, Council approval process, etc. which adversely impacts this author.
[A] A Global Location Map:

[B] Katoomba- Sydney Location Map:
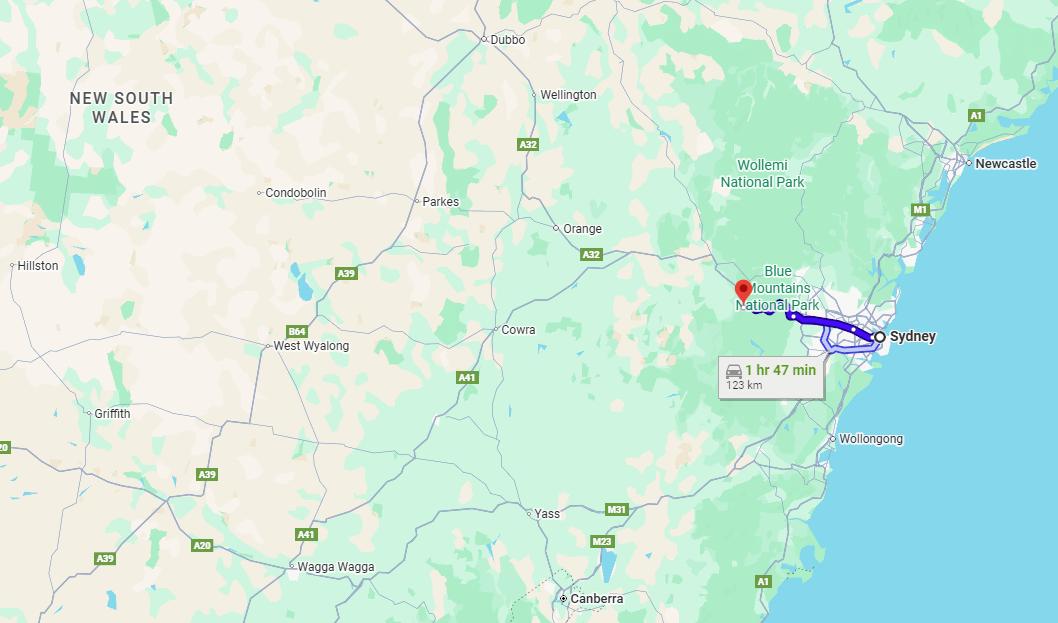
The town of Katoomba is about 100km west of Sydney by train or driving via the M4 Motorway.
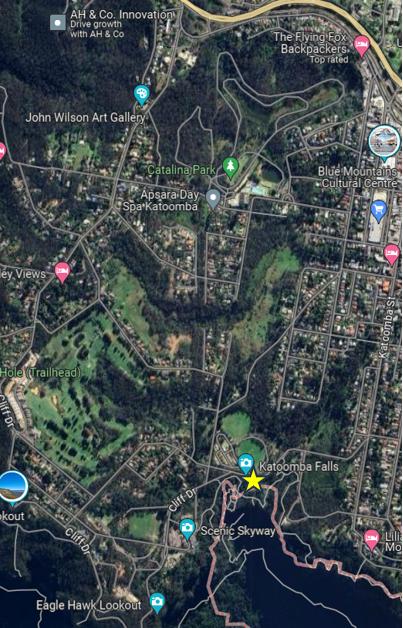
[C] Katoomba Falls Creek Valley Map:

This map section shows part of the township of Katoomba in the Blue Mountains and within that section the red circle indicates the general location of North’s Estate Conservation Area juxtaposed west of Katoomba town centre and south of the Great Western Highway/Railway. Note: ‘Wells Street‘ labelled which lies within that Estate. [Source: Google Maps]
[D] ‘North’s Estate Heritage Conservation Area’ extract historic cartilage map (within):

This historical complete map is sourced from the real estate advertising flyer for the original housing subdivision of North’s Estate dating back to 1883. Why? Hey the railway arrived in Katoomba (then the (sandstone rock ‘The Crushers’ in 1874). An entrepreneurial gold mine! Note that Wells Street is not shown as per the current map above, but instead labelled as Kamillaroi Road, but it is one in the same. Note also: ‘Kamillaroi’ is Aboriginal; ‘Wells’ is not Aboriginal. It is probable that Council renamed it. Many of the other street names have Aboriginal. origin. [Source: ‘Draft Heritage Data Form, Blue Mountains Heritage 2016’, Blue Mountains City Council]
So hopefully now as a reader to this article, you can find the location of where we are talking about.
Prices per night under San Francisco based Airbnb…
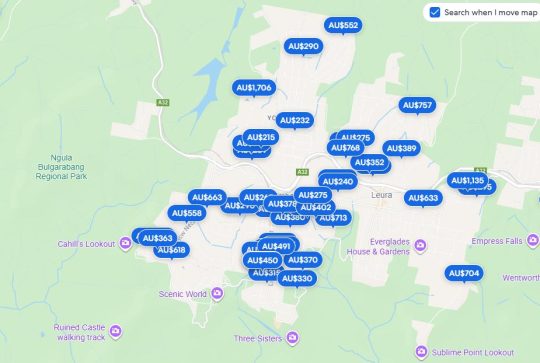
Katoomba invaded by Airbnb-style short stay holiday lets. Not all are shown on this map. [Source: Google Maps 2025]
PART V. Critique of Blue Mountains Council’s mistreatment of ‘North’s Estate Heritage Conservation Area’
[AUTHOR’S NOTE: A ‘critique’ is not just criticism, but also evaluation and judgment, with some constructive recognition of content of merit. Whilst we do criticise certain aspects of this Council documented report, we also constructive when we consider content to be apt, based upon our own insight and research. Such critique comes from this author’s personal background (academically, professionally, research, local knowledge and reasonable longevity from living in the subject area. The author of this article is an Analyst by qualification and experience. This article aims to provide thoughtful insight and feedback of the report (the oddly entitled ‘Draft Heritage Data Form‘). We encourage a deeper understanding of the concept and details of what comprises a ‘Heritage Conservation Area’, that it be formally completed, enhanced to best practice standards, then displayed as a comprehensive draft #2 publicly freely, consulted publicly, before being legally gazetted and thereafter legally enforced.]
Here we focus on ‘North’s Estate Heritage Conservation Area‘, being where we are based and reside. Again, this is Council’s ‘Draft Heritage Data Form‘ pertaining to this heritage ‘item’:
Loading...
This enclosed document, Council’s ‘Draft Heritage Data Form‘ pertaining to this heritage ‘item’ (or really ‘area’) warrants a few critiques, as follows:
[Our Critique #1] The form is in 2025 dated 2016, making it in December 2025 being a decade old, so sending a message that it has been since ignored by Council.
[Our Critique #2] The form is in 2025, remains a “Draft” a decade later. Why? Council does not care. Council only prepared this document (or rather was legally required to do so because of NSW Government legislation in 2015 re-branding what was zoned ‘Period Housing’ to be ‘Heritage Conservation’. Cynically, this effectively was just a tokenistic name change.
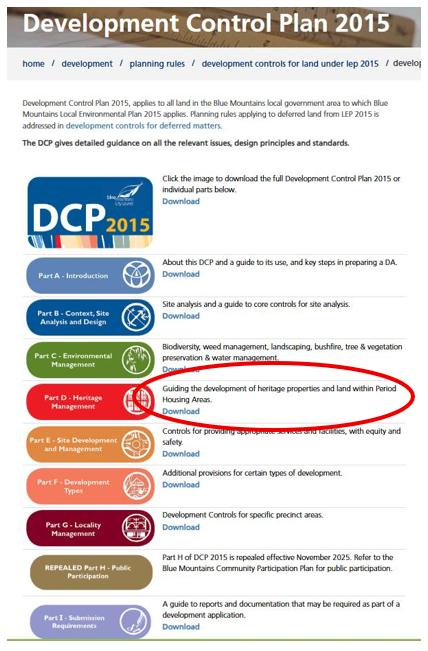
[Our Critique #3] Council has overlooked its own website concerning heritage conservation across the Blue Mountains local government area. How so? Well, its Development Control Plan of 2015 still continues to use the long obsolete term ‘Period Housing‘ (circled below). This reflects Council’s disregard towards updating its heritage management records and rules.
[Our Critique #4] The form was not written by Council. As highlighted above, it was researched and compiled by outsourced ring-in consultants from Sydney – the likes of Paul Davies Heritage Architects Pty Ltd (of Drummoyne, Sydney), (Robyn) Conroy Heritage Planning (of Surry Hills, Sydney), Croft & Associates Pty Ltd (of Baulkham Hills, Sydney), Meredith Walker (of Rockdale?, Sydney), Tropman &Tropman Architects, of 55 Lower Fort St, The Rocks, Sydney.
[Our Critique #5] The Statement of Significance at pages 1 and 2 requires factual historical correcting.
Yes, we note that the ‘Level of Significance’ for North’s Estate is at both ‘Local’ Level (Blue Mountain Local Government Area and at ‘State’ Level (New South Wales). So this is not insignificant.
The North’s Estate Heritage Conservation Area (HCA) in fact dates to 1876 when the then Government of the colony of New South Wales sold a large bushland parcel of the Blue Mountains plateau (western part of today’s Katoomba around the Katoomba Falls environs) to English immigrant, stockbroker, miner then property developer John Britty North (1831-1917). North subdivided the northernmost part of his property for residential development in 1883 and it became known as North’s Estate, the very first (and so oldest) housing subdivision in the Blue Mountains region.
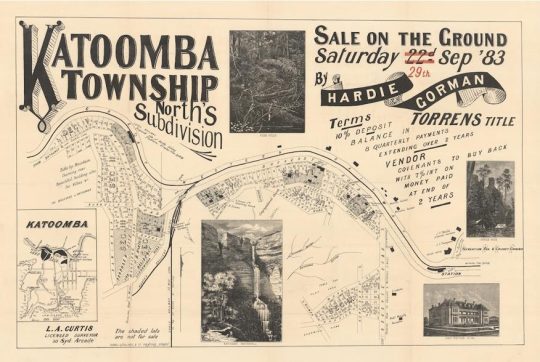
This was the original real estate advertisement for new land releases as part of then ‘North’s Subdivision’ Estate circa mid-1883 and likely in one of Sydney’s newspapers – either The Sydney Morning Herald (from 1842 – current), the Illustrated Sydney News (1853-1894), the Sydney Mail (1860-1938).
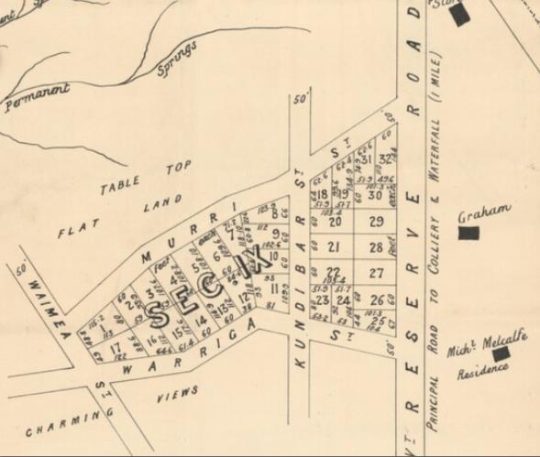
Close up extract map of North’s Estate from the original 1883 real estate advertisement above. The area size is about 200m (E-W) x 100m (N-S)
This is where The Habitat Advocate base resides. It is also especially why, one takes a special interest in this matter. We are here, home long located in North’s Estate of 1883 ‘SEC IX‘.
Yes, we after 25 hard-working and costly investment renovation years, take a focused interest in what happens in our neighbourhood that could try to ever undermine it.
Balmoral Guesthouse as it is today (built in 1880) at 196 Bathurst Road Katoomba. Built as a guesthouse this two-storey (13 room) Victorian Italianate villa was situated cleverly convenient level street walking distance (200m) from new Katoomba railway station then, recalling well before the advent of motor cars!
PART VI. A Case in Point
In 2006, an immediate neighbour of ours within North’s Estate Heritage Conservation Area (HCA) ‘SEC IX’ (per the mapping above) had purchased a residential property having a pre-existing heritage detached residential dwelling, so at the time of writing, close to 20 years ago. Extensive renovations over the years in sympathy with the colonial cottage style character of the property and the HCA were undertaken, likely at substantial cost. For ethical privacy reason, we choose not to identify the property herein, since the issue we raise is of a failed process by Council.
We became aware of a new third outbuilding being constructed in the backyard in November 2025 – an outdoor backyard sauna. But by Sunday 6th December 2025, the scale of that build and its 350mm close proximity to our fence seemed to be an over-development of the site. We’re talking about an under a 700m2 block in a low density residential zone in a designated heritage area.
We’ve also learned subsequently that the property is to be yet another Airbnb-style holiday let investment, so no longer to be owner-occupied. It will add to the more than an dozen holiday lets within the tiny (HCA) ‘SEC IX‘. None of this this was previously communicated to us as an immediate neighbour. We phoned and left a non-contextual voice message just for the owner to call one back. Ignored.
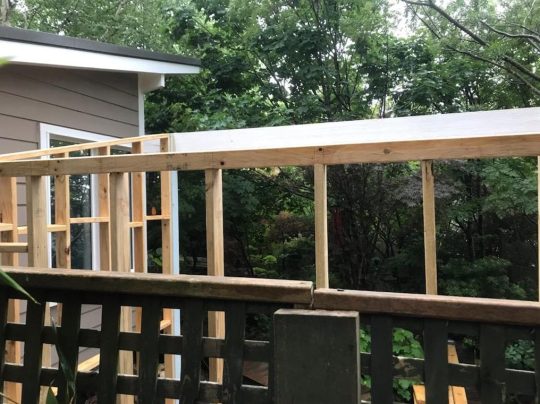
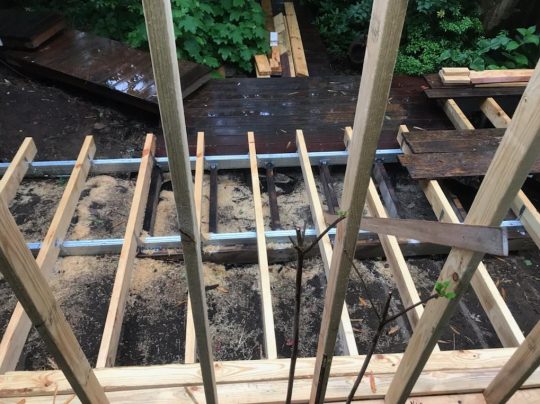
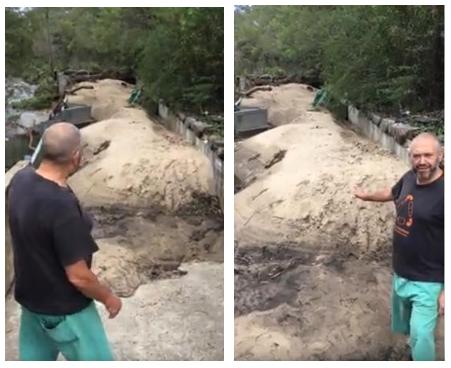
Frustrated, here are the subsequent photos from our side of the fence of this new build in progress at the time of writing:
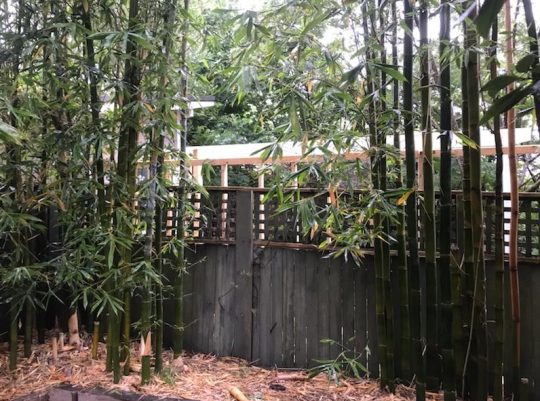
Note that due to the small size of our own residential block, some time ago we planted clumping (non-running) low maintenance bamboo hedging to create mutual privacy between our neighbours backyards, instead of say high maintenance dark conifers. Following our prior consultation with adjoining neighbours, our choice with the clumping bamboo to establish mutual privacy was welcomed by all our adjoining neighbours.
Note to the left of the photo the previous entertainment pavilion build (new outbuilding #2) i addition to a carport (outbuilding #1) on site. Yet legally, only two outbuildings (not three) are permitted in this low density residential area. After which 3+ outbuildings downgrades this low density heritage residential area to medium density and ultimately to high density.

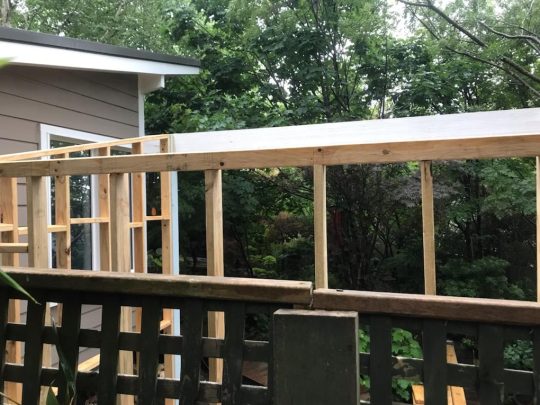
Another proximity photo shows the roof rafter of this new backyard sauna to be just a 350mm (1 foot) setback from our boundary. Unbelievable! The new sauna wall is to be just 500mm setback from our fence. This setback is illegal. It has to be a minimum setback to any boundary of 1400mm. It is a very arrogant intrusion by an adjoining neighbour.
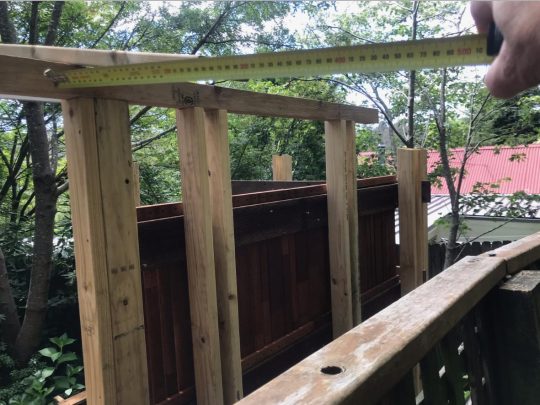
And we’re not exaggerating our measurements. Evidence by us from our side of the fence always!
This backyard sauna fabrication is using cheap and combustible pinewood which is illegal in our bushfire prone fire zone. This is a cheap cowboy backyard build. We soon learn it’s been going ahead without Council knowledge let alone approval. Our home is dangerously exposed potentially to this a large bushfire torch on our boundary – and it’s all being setup for Airbnb holiday let parties using the pavilion and now this sauna as sales features on our residential boundary for Christ sake!
So, inquisitive, one wrote to Blue Mountains Council (BMCC) by email on the Monday morning thus:
Correspondence #1:
Monday 8th December 2025, one phones Council and reports the matter to the Council’s Customer Service Department.
A CSR (Customer Service Request) is requested by self from Council for the record: #634961.
Correspondence #2:
Same day, one sends a followup email to Council with the details and including four relevant photos as evidence of work in progress, thus:
Attention: [Council’s Health & Building Surveyor]
Blue Mountains City Council
Locked Bag 5
KATOOMBA NSW 2780
8th December 2015
Dear Mr XXXXXXXX,
I wish to enquire with you at Blue Mountains City Council whether a current backyard construction adjoining my residential property has BMCC approval and is appropriate.
Currently, there is a building construction underway at (SUBJECT DEVELOPMENT SITE) Katoomba over my back fence adjoining our property that has just become obvious to me, yet it would appear to be perhaps excessive? I attach a few current photos of the work in progress from our property for your information for clarity. This is a heritage residential precinct.
My property is located at (SUBJECT DEVELOPMENT SITE) Katoomba and in recent weeks I have noted that a sizeable building development is underway that is very noticeable and comes to being measured just 350mm from our back fence and looks to become well above our fence line once completed. Our neighbour, whom we are otherwise amicable with, is currently in the process of having this construction become a new backyard sauna. Of late we have noted that it is very dominant and close to and rises above our rear fence line. It is unclear whether this will entail an associated noise impost once operational.
Is Council aware of this new construction development and does this have Council permission and approval? Since I have received no such written notice of this development.
Kind regards,
Steven Ridd
Correspondence #3:
Two days later, on Wednesday 10th December 2025, one phones Council to followup the Monday request.
Council advises that as yet no ranger or investigator has been assigned to this matter. One requests a documented ‘Customer Service Request reference number (CSR) and is advised of CSR #634109 about of this raised neighbourhood concern.
Council advises that the Health & Building Surveyor addressed in one’s email is not with Council (presumable he must have resigned and Council has deleted all records of his senior staff role existence). One had dealt with him co-operatively for over a decade regarding one’s own legitimate and approved development application.
Correspondence #4:
On Friday 12th December 2025 four days later, one received its first reply from Council on this reported matter, thus:
“Dear Mr Ridd,
Council do not hold records of the development you have described at (SUBJECT DEVELOPMENT SITE) Katoomba.
The State Environmental Planning Policy (Exempt and Complying Development Codes) 2008 (‘Exempt Code’) outlines development that can be undertaken without requiring development consent.
The photographs you have provided show the structure will likely largely meets subdivision 9 of Part 2 of the Exempt Code when built, except perhaps the distance to the boundary.
Would you like this structure investigated for distance to the boundary? If so, please let me know.
Please be aware that Council does not disclose to a person who complained about them, but it may be very obvious to you neighbour that it was you.
Regards,
Judy Le Breton | Senior Investigations Officer | t: 02 4780 5000 | e: council@bmcc.nsw.gov.au
Blue Mountains City Council | council@bmcc.nsw.gov.au | www.bmcc.nsw.gov.au | Locked Bag 1005 Katoomba NSW 2780 ”
Some relevant observations at this juncture:
(i) One’s presumption had been correct, that the owner had not sought nor obtained Council approval for the third outbuilding – the sauna;
(ii) There are no plans or design drawings for the sauna. As an immediately adjoining neighbour to this construction development, one is entitled to be notified in advance of such a development;
(iii) How can this development (over-development) be exempt from planning controls such as the HCA and Council’s rules – its Development Control Plan 2015, DCP 2015 Amendment 8 Part D – Heritage Management, and that this residential area is zoned ‘R2: Low-Density Residential’?;
(iv) Why should one as a resident be required to research and interpret State Environment Planning Policy? This is the task of Council;
(v) Is this person Judy Le Breton, a supposed Senior Investigations Officer in any way qualified to assess this development for its compliance with Council’s planning rules?
Correspondence #5:
Same day, on Friday 12th December 2025, one phone’s Council requesting to speak with Ms Le Breton, but she is not there and so leaves a message.
Another Customer Service Request number is issued to Mr Ridd: ‘CSR 634961‘.
Correspondence #6:
Same day, on Friday 12th December 2025, one emails Council referencing CSR 634961 and attaches a copy of the North’s Estate Heritage Conservation Area document, obtained from Council’s very own website. This is because Ms Le Breton in her email reply did not mention this very relevant document, nor mention Council’s relevant zoning requirements, nor Council’s the DCP 15 Heritage Management, but only state policy.
Correspondence #7:
Then on Friday 12th December 2025, Mr Ridd emails Ms Le Breton as follows:
RE: (Subject address) Katoomba – new development adjoining (CSR 634961)
Hello Ms Le Breton,
Thank you for your email reply.
However, I reported this to Council by phone last Monday 8th December 2025, so some four days prior. It is disappointing that this is the first that I have had Council contact me about this. Had the weather not been rainy this past week, the neighbour ‘Wayne’ may well have finish the build by now.
I follow with Council by phone on Wednesday 10th December and was told that a ranger had not yet been assigned to the matter.
Yes. I wish to check due process and the legalities concerning this new development. I don’t mind in the slightest about the owner knowing it is me (over the corner side fence) raining my concerns.
I have known the previous owner (SUBJECT DEVELOPMENT SITE) for over the past 15 years on a very amicable basis, not just as adjoining neighbours but as good friends.
I have today followed up again by phoning Council after receiving your email reply below.
My Concern that should be addressed by Council in this matter:
(1) I am concerned that you seem to be fobbing me off to research some state legislation online. Is that not your task or that of Council’s Development Monitor Team to check? This would seem lazy?
(2) My wife and I had our own land use application submitted and approved by Council submitted back in 2005 (Reference X/XXX/2005). It subsequently gained substantial commencement status. We had to comply with the many rules for the renovations and extensions and the conditions of consent. So we are aware of the rules and restrictions for our own development which after many years remains ongoing.
(3) One of the rules is that our building may not extend to within 1400mm from any boundary on the property land site. However, this new outdoor building measures just 350mm from our boundary.
(4) I note that you say Council is not aware of this development at (SUBJECT DEVELOPMENT SITE) Katoomba (literally adjoining part of our back fence).
(5) I point out that the fabrication is being made using pine timber, however this is in breach of the bushfire regulations since both properties are situated within a bushfire high risk zone (<50 metres) , so demanding non-combustive construction material (not pine) for all exterior cladding.
(6) This build is a second one that adjoin this, (The “pavilion”) probably also in fabricated in pine.
(7) In contrast, all our exterior materials are in approved Merbau hardwood or concrete sheeting (on a temporary basis). It has thus far cost us a considerable outlay over the years
trying to do the right thing by Councils rules and the legislation.
(8) This residential area is a designated heritage conservation area known as North’s Estate heritage Conservation Area (Reference K171) (see attached copy and link to Council’s website ^https://www.bmcc.nsw.gov.au/documents/map-and-heritage-inventory-sheet-k171 ) The heritage conservation assigns a high value to the amenity and streetscape to this rare purely residential area. It seems you are not aware of this special heritage conservation classification that include both xxxxxxxxxxx and xxxxxxxxxxxx Streets.
(9) It is not supposed to have any tourism development, yet over recent years numerous homes have been converted to permanent Airbnb’s. It is my understanding that this is planned with (SUBJECT DEVELOPMENT SITE), with this new build become a outdoor sauna and shower in the garden. Others include 4, 7 (x2), 10, and 8 Kundibar Street – none with local resident notification and probably nor Council notification, awareness, nor approval. So they would thus be each in breach of the classification. Quote at page 7: “it does not provide tourist accommodation or facilities.”
(10) We have received no plans or written information from the owner about what is proposed in this “sauna” – such as a potential fireplace, noise, perhaps amplified music, hours of use. As such this would seem to be an illegal development.
(11) I wrote to (Council’s Health & Building Surveyor) on this , however he seems to have retired or moved on from Council. We’ve dealt with him for many years he was very knowledgeable about development matters and quite helpful and responsive.
Please investigate this onsite ASAP and not after Christmas and New Year break, since the thing will likely be operational by then. Feel free to contact me to arrange access to our property for inspection from our side of the fence.
Yours faithfully,
Steven Ridd
Correspondence #8:
[On Friday 19th December 2025, Mr Ridd from his backyard happened to observe the subject owner talking with an unrecognisable man close to the back fence – presumably an inspector from Council. Then on Monday 22nd December 2025, Mr Ridd received to following email from Council]
(Subject Address) Katoomba (CSR 634961)
Dear Mr Ridd,
I have inspected the structure being built at the rear of (SUBJECT DEVELOPMENT SITE) Katoomba. I am satisfied it meets the provision of the State Environmental Planning Policy (Exempt and Complying Development Codes) 2008 (‘Exempt SEPP’), and no action is to be taken by Council.
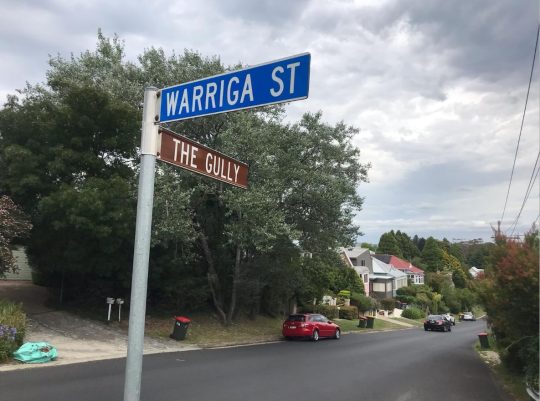
These codes relate to development that can be undertaken without requiring the consent of Council. I have addressed your noise concerns with the owner of 5 Warriga Street. I am satisfied with the noise mitigation measures that will be employed, however should noise become an issue, you are able to seek a Noise Abatement Order via the Local Court.
The structure being built, whilst within a Heritage Conservation Area, is not a Heritage Item. This means that many of the Exempt SEPP development provisions (including those that apply to the structure being built at (SUBJECT DEVELOPMENT SITE) can be applied without seeking the approval of Council.
Assessing compliance with state legislation is a major part of my job. The legislation largely determines what is allowed and what is not.
In relation to your Airbnb concerns, the Department of Fair Trading changed the rules around short term rental accommodation and it is no longer regulated by Council.
Regards,
Judy Le Breton | Senior Investigations Officer | t 02 4780 5000 | e council@bmcc.nsw.gov.au
Blue Mountains City Council | council@bmcc.nsw.gov.au | www.bmcc.nsw.gov.au | Locked Bag 1005 Katoomba NSW 2780
Correspondence #9:
22nd December 2025
Hello Ms Le Breton,
I total reject your rejection of the rules.
You are acting in breach of Council’s own regulations.
You have offered me no justification for doing so.
So, I am going public on this issue, having first tried my best through normal channels unsuccessfully.
Yours faithfully,
Steven Ridd
Our Critique:
(1) The sole person observed by Mr Ridd who inspected onsite the Friday prior to Ms Le Breton’s email decision of the following Monday, was not female.
(2) For a Council development compliance inspector to firstly admit that Council had not been notified of the development and then to approve it anyway is tantamount to incompetent conduct, if not corrupt conduct, in our view.
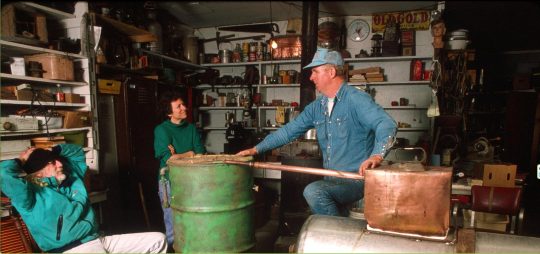
(3) We deal with Ms Le Breton’s obfuscating reliance upon State Environmental Planning Policy (Exempt and Complying Development Codes) 2008 (‘Exempt SEPP’) further on, but frankly what is her job and is she doing it? So Mountains backyarders don’t require the consent of Mountains Council these days? Hey, well that sends a message! May be I should build meself a backyard moonshine still – surely give Mountains Culture Brewing a run for its money, I reckon. Got the room and all.
So, what a slack job Council Senior Investigator Le Breton as a compliance inspector quoting exempt State legislation by default. Having the shallow interest of a politician and the skills of a Grade 3 school student in …our view.
(4) Noise? Council Senior Investigator Le Breton dismisses noise issues. Back on me: She again cops out and quotes: “however should noise become an issue, you are able to seek a Noise Abatement Order via the Local Court.” Her cost? Her involvement? Nuh!
(5) Senior Investigator Le Bereton quoted response: “The structure being built, whilst within a Heritage Conservation Area, is not a Heritage Item.” Yes, so is that not a breach of the HCA? What if this property owner constructs another six outhouses and houses a dozen holiday makers on his residential site. Council to reckon: nothing to see here? All EXEMPT?
(6) Quote: “In relation to your Airbnb concerns, the Department of Fair Trading changed the rules around short term rental accommodation and it is no longer regulated by Council.”
So no limit? What does heritage management mean Senior Investigator Le Breton? Nothing, a free for all? Le Breton has the slackest job on Council – do nothing, roneo copy and email state legislation. A eight year old could do that. Go back to megalopolis Sydney!
PART VII: Blue Mountains Planning – Shed Development Rules
[AUTHOR’S NOTE: Council is treating this sauna (to be) as no more than ‘a shed’.]
“In the Blue Mountains, a shed may be considered “exempt development” and not require council approval if it meets specific size, height, and setback criteria under the NSW planning rules.
The key setback requirement for an exempt shed is generally a minimum of 900mm from each boundary.” [AUTHOR’S NOTE: The owner’s setback of the sauna wall framing from Mr Ridd’s back fence is just 500 mm. It will be less than that once the wall cladding is added. The lean-to roof currently has one rafter 350 mm from the fence.]
Shed Requirements for Exempt Development in NSW
“If your shed meets all the following criteria (from the State Environmental Planning Policy (Exempt and Complying Development Codes) 2008), it is exempt and does not need a Development Application (DA):
“Size: No larger than 20 square metres in floor area in residential zones (50 sqm in rural zones).”
[Our Comment: The owner has not disclosed the eternal dimensions of the build to anyone, including Mr Ridd or to Council. It appears to be approximately 4m long (along tne fence), 2.5m deep and 2.5m high with a lean-to roof, so this make the overall floor area 10m2, not allowing for the addition of the proposed outdoor shower. But it seems to be being designed as it is constructed. There are no known design plans. Observations are that the owner and builder seem to be in regular onsite discussions as to what to do – making it up as they go along.]
“Height: No higher than 3 metres above ground level, or 2.4 metres if built within 1 metre of a boundary.”
[Our Comment: The subject build is within 500mm of our boundary, perhaps the lean-to being 2m at the fence line, rising to 2.5m on the other garden side.]
“Setback: A minimum setback of 900mm (0.9 metres) from each property boundary.”
[Our Comment: As mentioned above in this part, the owner’s setback of the sauna wall framing from Mr Ridd’s back fence is just 500 mm. It will be less than that once the wall cladding is added. The lean-to roof currently has one rafter just 350 mm from the fence.]
“Location: Must be located behind the building line of the main house.”
[Our Comment: Yes, from a public ‘streetscape’ narrow perspective, it is. Yet, it encroaches on the amenity of an adjoining neighbour, Mr Ridd. Neither the owner nor Council has not engaged in any resident consultation process in relation to (A) the North’s Estate Heritage Conservation Area, nor (B) Zoning of this R2 Low-Density Residential Zone, nor (C) This particular Backyard Sauna development]. Council frankly couldn’t give a shit.
“Number of structures: There are generally no more than two exempt development structures (e.g., sheds, carports) per property.”
[Our Comment: The subject owner has (1) a renovated carport, (2) a newly constructed (<4 years) pavilion (large entertainment shed – dimensions 5m (L) x 3m(D) x 3m (H) without any Council approval]
“Materials: If the property is on bushfire-prone land, the shed must be constructed of non-combustible materials. (Much of the Blue Mountains is bushfire-prone).”
[Comment: The subject property’s backyard sauna is zoned within ‘Bushfire Prone Land – Vegetation Buffer’ under Council’s emapping software, yet the pinewood fabrication is highly combustible and so a prohibited material.]
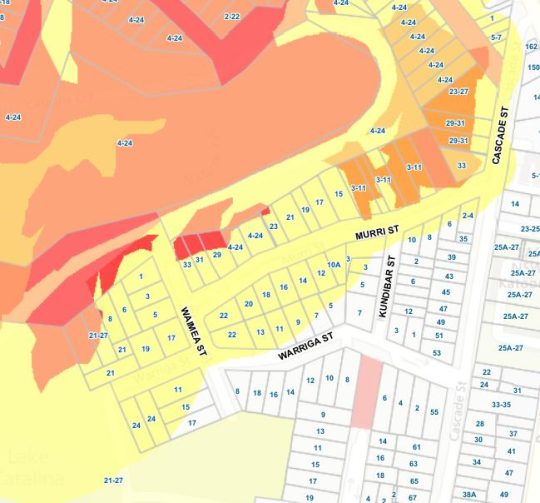
Bushfire Prone cadastral mapping of the subject section of North’s Estate ‘SEC IX’, without specifically identifying the subject property. [Source: Spectrum Spatial’s e-mapping on Blue Mountains Council’s website’s Interactive maps]
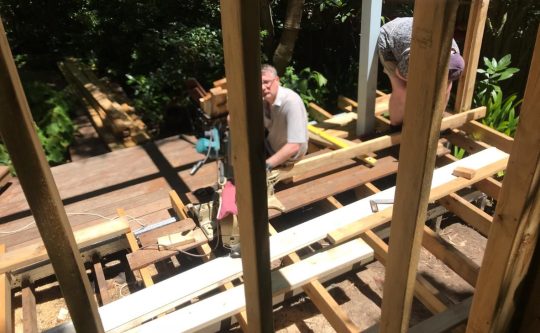
The subject backyard sauna under construction. [Photo by author from fence line].
“Other conditions: It cannot be a shipping container and must not interfere with access or fire safety measures of another building.”
[Comment: The backyard sauna poses a fire risk due to the combustible construction materials used, the need for a heating device to make the sauna functional, and likely no planned allowance form first retardant measures such as a fire blanket and fire extinguishers. In addition, the owner’s intention to soon dedicate the entire property to being an Airbnb holiday let would mean that such guests would likely not be trained in fire safety or fire supression in the event of a fire in the sauna. The close proximity of the backyard sauna to Mr Ridd’s rear fence would severely restrict fire fighting access Mr Ridd’s property from the rear.]
Neighbour Notification and Disputes
“Exempt Development: While there is no formal requirement to notify neighbours for exempt development, it is always recommended as a common courtesy to maintain good relations and prevent future disputes.”
[Our Comment: Council’s has advised that the property owner has not notified Council. The property owner has not notified adjoining neighbour (property owner) Mr Ridd. Mr Ridd has disputed Council’s lax interpretation that this backyard sauna is deemed ‘exempt development‘ under the the NSW SEPP (Exempt and Complying Development Code) 2008. Whilst physically minor in scale, compared with say a dwelling, the build fails to meet any definition of being a shed and breaches multiple rules as this article herein highlights and explains. is not a shed per se. It does indeed require formal council planning or construction approval, as well as notification to adjoining neighbours likely to be adversely impacted, and there be an opportunity for such neighbours to raise concerns and possible objections about such likely impacts. ]
“Development Application (DA): If your shed does not meet all the exempt development criteria (e.g., you want to build closer than 900mm to the boundary), you will need to submit a DA to the Blue Mountains City Council. In this case, neighbours will be formally notified during the exhibition period and have an opportunity to make submissions or raise concerns.”
[Our Comment: Hello! It ain’t just a shed. Construction needs to be halted immediately. It does not meet all the exempt development criteria (e.g., it is under 500mm setback from the side boundary). A DA needs to be submitted to the Blue Mountains (City) Council. Neighbours need to be formally notified during the exhibition period and have an opportunity to make submissions or raise concerns.]
“Actionable Steps
“Verify your property’s zoning and constraints: Use the NSW Planning Portal Spatial Viewer to check your specific property’s zoning, bushfire rating, and other potential constraints.”
[Our Comment: Been there with the bushfire rating, but more assessment is to be made about other zoning constraints herein in this article below in ‘PART IX. Scrutiny of LEP 2015/ DCP 2015 Zoning Compliance’]
“Confirm the rules: Review the full list of conditions in the State Environmental Planning Policy (Exempt and Complying Development Codes) 2008 and the Blue Mountains Development Control Plan (DCP) 2015 on the Council’s website.”
[Our Comment: It would have been wise for the property owner to have done so in advance, or sought professional advice. He would have saved time and money and effort and dispute with Mr Ridd, who would have preferred to utilise his Christmas break doing better things than dealing with a unnecessary dispute.]
“Contact the Council: If you are unsure whether your project is exempt, contact the Blue Mountains City Council’s planning department for advice.” [Our Comment: It would have been wise too.]
[AUTHOR’S NOTE: Council is treating this sauna (to be) as no more than ‘a shed’. However, this is incorrect. Unlike a shed, a sauna is not for storage (such as for garden tools) but instead intentionally intended for people to sit in. It requires a heat source (usually electricity). That presents a fire risk if not correctly installed by a qualified electrician with experience with sauna installations who knows the risks and follows the rules and uses the factory approved heating device(s). A sauna necessitates steam , so it requires a water source and water heater which creates noise. This particular sauna of the owners is to also have an adjoining cold shower attached. It will be part of a new Airbnb offering, one that has become popular overseas such as in Finland for decades. This then will attract multiple guests to party right by one’s back fence, so replacing what has for decades been a quite back corner of that owner’s backyard. It will risk posing a new annoying noise problem. With the electricity supply, this will facilitate guests to play music – how late and how loud? Council has abrogated it responsibility in controlling this unauthorised unplanned, unknown development in many ways.]
PART VIII: State Environmental Planning Policy (Exempt and Complying Development Codes) 2008
2.17 Specified development
The construction or installation of a cabana, cubby house, fernery, garden shed, gazebo or greenhouse is development specified for this code if it is not constructed or installed on or in a heritage item or a draft heritage item, on land in a foreshore area or in an environmentally sensitive area.
[AUTHOR’S NOTE: “In English, “cabana” refers to a small, often freestanding shelter typically found near pools or beaches. The term originates from the Spanish word “cabaña,” meaning hut or cabin, and has evolved to describe structures that offer a combination of shade, privacy, and leisure amenities in outdoor settings.”. Such a structure was recently built by the subject owner in his backyard, which he dubs ‘The Pavilion”. The backyard sauna is to be a similar example of the build.]
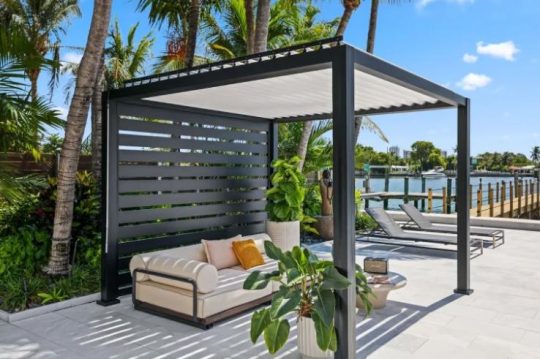
A sample cabana
2.18 Development standards
(1) The standards specified for that development are that the development must—
(a) (Repealed)
(b) not have a floor area of more than—
(i) on land in Zone RU1, RU2, RU3, RU4, RU6 or R5—50m2, or [OUR COMMENT: these are rural zonings] (ii) on land in any other zone—20m2, and
(c) be not higher than 3m above ground level (existing), and
(d) be located at a distance from each lot boundary of at least—
(i) for development carried out in Zone RU1, RU2, RU3, RU4, RU6 or R5—5m, or
(ii) for development carried out in any other zone—900mm, and
(e) if it is not on land in Zone RU1, RU2, RU3, RU4 or RU6—be located behind the building line of any road frontage, and
(f) not be a shipping container, and
(g) be constructed or installed so that roofwater is disposed of without causing a nuisance to adjoining owners, and
[OUR COMMENT: There is as yet no indication that any guttering to the backyard sauna (to be) is to be constructed/installed. As mentioned, no known design plans for this backyard sauna exist. The lean-to roof area slopes back towards and very close to Mr Ridd’s fence. The roof area is estimated to be 4m x 2.5 so an area of about 10m2 . In the frequent event of heavy rainfall that roofwater would be sheeted on to Mr Ridd’s back fence causing a nuisance and likely damage, including timber rot. There is no know stormwater management known].
(h) to the extent it is comprised of metal components—be constructed of low reflective, factory pre-coloured materials if it is located on land in a residential zone, and
[OUR COMMENT: The materials are unknown, since no known design plans for this backyard sauna exist. However, what has been observed is the use of pinewood for the wall and floor framing].
(i) if it is located on bush fire prone land and is less than 5m from a dwelling—be constructed of non-combustible material, and
[OUR COMMENT: What has been observed is the use of pinewood for the wall and floor framing, which is highly combustible and so prohibited in this bushfire prone zone].
(j) if it is constructed or installed in a heritage conservation area or a draft heritage conservation area—be located in the rear yard, and
(k) if it is located adjacent to another building—be located so that it does not interfere with the entry to, or exit from, or the fire safety measures contained within, that building, and
(l) be a Class 10 building and not be habitable, and
(m) be located at least 1m from any registered easement
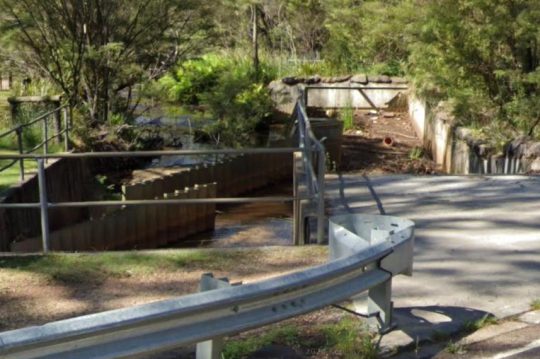
[Our Comment: The subject backyard sauna is being constructed directly vertically above a Sydney Water Sewer main, which runs from the top via a manhole access on Mr Ridd’s side of the fence under the back fence and directly below the new backyard sauna construction. This is illegal. Mr Ridd became familiar with such a law during the process of his own renovation approved by Council back in 2005 involving stormwater management planning.]
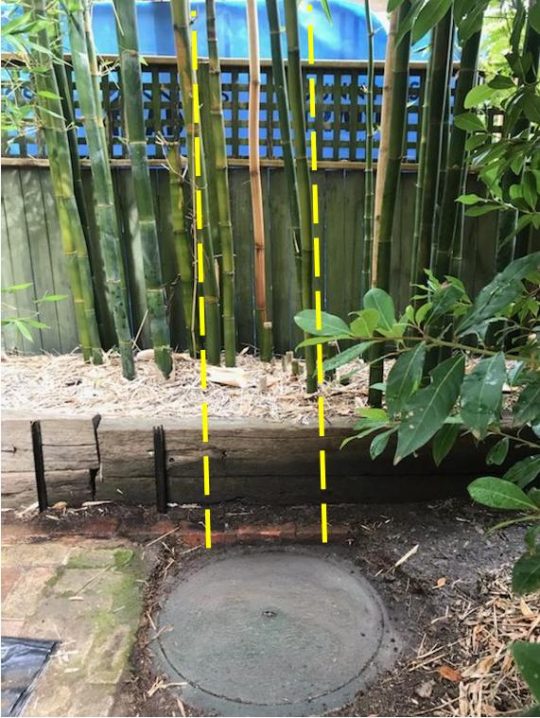
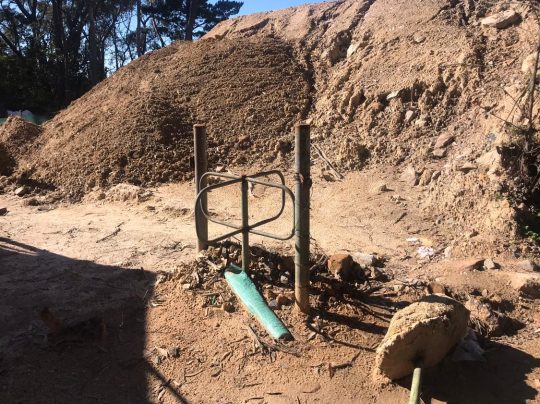
Mr Ridd’s backyard adjoining the subject property has a pre-existing trespassing sewer main from decades prior with a manhole access (shown above) near the back boundary. This sewer main runs from this access manhole directly behind under the rear fence (10 feet deep) downstream. So the new backyard sauna is being constructed by the subject property owner directly above the Sydney Water sewer registered easement. So this new backyard sauna build in situ is illegal.
(n) in relation to a cabana—not be connected to water supply or sewerage services.
[Our Comment: The subject backyard sauna is to be connected to water supply for both the sauna heater and the shower.]
(2) There must not be more than 2 developments per lot.
[Our Comment: The subject backyard sauna is to be the third outbuilding, following the new cabana adjacent (dubbed ‘the pavilion’) in addition to the carport]
SOURCE: ^https://legislation.nsw.gov.au/view/html/inforce/current/epi-2008-0572#sec.2.18
PART IX. Scrutiny of LEP 2015/ DCP 2015 Zoning Compliance
We note the following zoning restrictions to this subject property and to ours, likewise.
This information is publicly available on Blue Mountains Council’s website’s Interactive Maps subdomain: ^https://www.bmcc.nsw.gov.au/property-search (Click view our interactive maps link).
AUTHORS NOTES:
Of relevance:
(1) LEP 2015 Zone ‘R2 – Low Density Residential
(2) LEP 2015 Heritage – K171 North’s Estate Conservation Area (General)
(3) Bushfire Prone Land – Vegetation Buffer
References and Further Reading:
[AUTHOR’S NOTE: Most references are publicly available at the time of publishing this article. Each reference below was accessed by this article’s author at the time of publishing so the date of the reference is accurate of as that date. Given that governments habitually change their websites, the included online links may die over time; in which case, where possible, we have also included a copy of the relevant document as an imbedded PDF document that is downloadable by readers of this article. ]
An example:
SOURCE: ^https://yoursay.bmcc.nsw.gov.au/periodhousing/widgets/190457/documents
[1] ‘Draft Heritage Data Form – Blue Mountains Heritage 2016‘, 2014, external consultant report on North’s Estate Heritage Conservation Area, Local ID K171, by Paul Davies Heritage Architects Pty Ltd (Sydney), and by Conroy Heritage Planning (Sydney), 11 pages (file size 476KB), ^https://www.bmcc.nsw.gov.au/documents/map-and-heritage-inventory-sheet-k171, a PDF copy embedded and downloadable below.
Loading...
[2] ‘Heritage Conservation Areas‘, Blue Mountains Council website, 2015, ^https://www.bmcc.nsw.gov.au/heritage/heritage-conservation-areas), 5 pages
[3] ‘DCP 2015 Part D Heritage Management – Guiding the development of heritage properties‘, Revision: Amendment 8, November 2015, Blue Mountains Council, ^https://www.bmcc.nsw.gov.au/documents/dcp-2015-part-d-heritage-management, copy in PDF embedded below for download and printing, 88 pages
Loading...
[4] ‘Development Control Plan 2015‘, 2015, Blue Mountains Council website, ^https://www.bmcc.nsw.gov.au/development/planning-rules/development-controls-for-land-zoned-under-LEP-2015/DCP-2015, Full Version (916 pages) ^https://www.bmcc.nsw.gov.au/documents/dcp-2015-full-version
[5] ‘Fact Sheet – Period Housing Areas conversion to Heritage Conservation Areas‘, 2018-06-29, Blue Mountains Council website, ^https://yoursay.bmcc.nsw.gov.au/periodhousing/widgets/190457/documents, 2 pages
Loading...
[6] ‘Fact Sheet – Developing in a Heritage Conservation Area‘, 2018-06-29, Blue Mountains Council website, ^https://yoursay.bmcc.nsw.gov.au/periodhousing/widgets/190457/documents, 2 pages
Loading...
[7] ‘Blue Mountains Heritage Strategy 2021-2025‘, (undated), by Blue Mountains Council and probably mostly scribed by its external consultant from Sydney, 60 pages, ^https://www.bmcc.nsw.gov.au/advanced-search?keys=The+Blue+Mountains+Heritage+Strategy+2021-2025
Part 1: Strategy Background:
Loading...
Part 2: Strategy:
Loading...
Part 3: Implementation Plan:
Loading...
[8] ‘blue mountains shed development setback rules neighbours‘, (an Internet web browser search phrase typed by yours truly in ‘Google Chrome’ software), Result per Google AI Overview): See above Part VII above.
[9] ‘Property Map Search‘, Blue Mountains Council’s website, ^https://www.bmcc.nsw.gov.au/property-search
“Search for information about a property:
Use our interactive maps to identify the zoning and site characteristics of land. This property search tool is useful in establishing site constraints and development opportunities.
-
-
- Click on the link below and add the property address.
- Click the ‘layers icon’ in the top right of the webpage, and then tick the maps to view.
- More information is also available by clicking on the three dots to the right of the Lot and Plan number, on the left side of the webpage.
- For the best user experience, please use Google Chrome to browse this website.”
-
View Our Interactive Maps: ^https://emapping.bmcc.nsw.gov.au/connect/analyst/mobile/#/main?mapcfg=Locality&lang=en-au
[10] ‘State Environmental Planning Policy (Exempt and Complying Development Codes) 2008‘, 2008, NSW Government, ^https://legislation.nsw.gov.au/view/html/inforce/current/epi-2008-0572#sec.2.18
[11] ‘Pictorial Memories – Blue Mountains‘, (book) by John Low OAM, 2ED, 1994, published by Kinsclear Books, 135 pages.
[12] ‘Blue Mountains Council’s ‘love local’ hypocrisy towards small business‘, 2021-05-21, Nature Trail website (click link below)
Blue Mountains Council’s ‘love local’ hypocrisy towards local businesses
[13] ‘Century-old Blue Mountains kiosk to get new lease of life‘, 2019-04-17, by
The Gully (Katoomba) holds meaningless heritage value to Blue Mountains Council, except exploitative propaganda and enterprise value to it. No trust.
References and Further Reading:
[This article’s publishing last updated: 11th January 2026.]


")

")