Archive for the ‘Threats from Stormwater Runoff’ Category

Blue Mountains City Council’s neglect of Katoomba Falls and Kedumba River

Tuesday, June 4th, 2024

This is yet another example of neglected stormwater runoff maintenance by Blue Mountains {city} Council.     Its in-creek water pollution trap (vane style) device is situated just above Katoomba Falls (left of photo). 
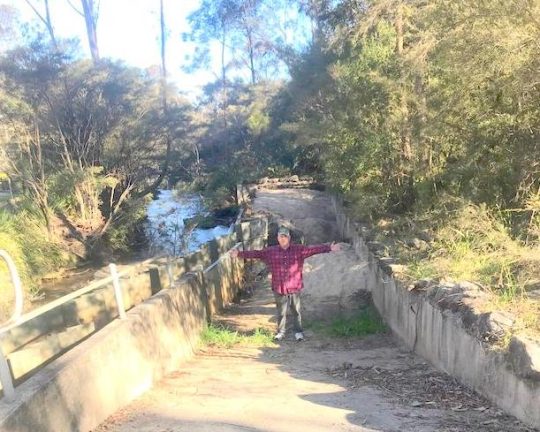
 

Our editor standing in front of large piles of sand pollution re-directed out of Katoomba Falls Creek by an in-creek pollution control device (left). [Photo by The Habitat Advocate, taken Thursday 30th May-2024.]


This pollution detritus trap has, from our very local experience over two decades, been typically full of destroyed native vegetation debris caused by (a) torrential rain events, and (b) bushland clearing (deforestation).  It has also been observed typically full of siltation from (a) upstream creek bank erosion through Maple Grove, (b) from housing construction sand and graded topsoil, and (c) from unfiltered urban stormwater waste ignored by Council since it was established first as the Municipality of Katoomba in 1889. 

We have lived in The Gully Water Catchment since 2001.  The Gully Water Catchment includes all land with watercourses and natural drainage flowing to Katoomba Falls, and we have taken a keen interest in this natural place.  

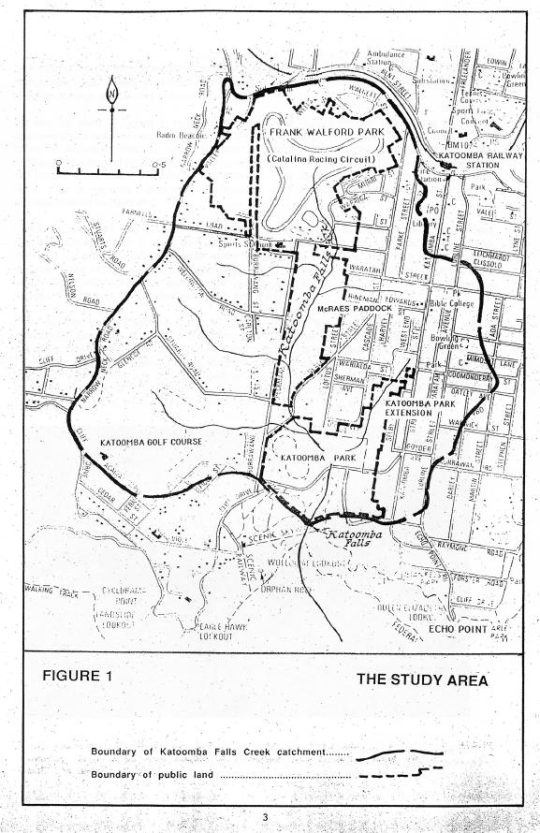
Katoomba Falls Creek Catchment as it was then called in 1993.   [SOURCE: The Bell Report]


From our observed experience as local environmental activists, Council’s ongoing management culture is such that it focuses on the capital works projects, obtains external grant funding (usually from the NSW Government) but then fails to budget and resource the ongoing maintenance of such capital works projects.  This Baramy Trap is another case in point.

We repeatedly observe this pollution trap full and overflowing for months at a time, so the trap overflows and the continuing detritus flows downstream into the downstream Kedumba River to supply Greater Sydney’s drinking water to Sydney’s artificial Lake Burragorang for Sydney and a Greater Sydney so scarily morphing beyond.  Currently this pollution trap has been full of sand sediment for many months.   

The above photo shows the concrete ramp down to the pollution trap for access by a small front-end mechanical loader designed to remove the sand and debris pollution into a waiting tip-truck.  
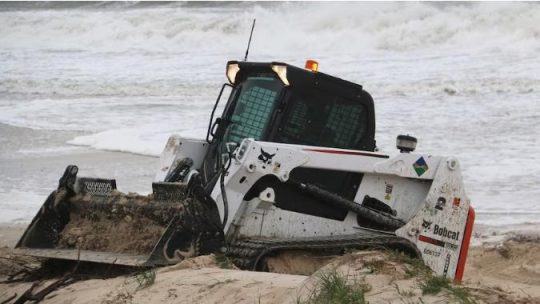
A Bobcat more suited to a construction site or at a beach as in this example photo.  But at Blue Mountains {city} Council it’s Missing-In-Action.


Council is supposed to maintain it and clean it out on an ‘as-needed‘ basis periodically, but it doesn’t.  The following is an extract of Baramy’s terms and conditions for this pollution device once installed.  

We obtained a copy of these terms and conditions back in 2004 when The Friends of Katoomba Falls Creek Valley Inc. (the Friends) sought a quote for a similar but smaller pollution device (4 m long x 2.1 m wide) previously to be constructed in the same creek further upstream.   Baramy’s quote came in at $26,000 and we referred this initiative for action/grant funding to Council – it being the custodian of this community land and the creek water catchment.  But Council ignored it.  

In this case Council is the “customer” having paid to have this much larger device constructed by Baramy Engineering in this different location much further downstream.  It would have cost Council double, constructed probably around 2005 from one’s memory.  

Council’s culture 

Council has form of having its other non-environmental priorities, such as its latest newfangled ‘Planetary Health Initiative’ to showcase its environmental stewardship, when it is just more greenwashing.

Previously, all such debris, sediment and stormwater pollution into the creek used to just flow over Katoomba Cascades and further downstream over Katoomba Falls into the Kedumba River below and southward through the Jamison Valley.   
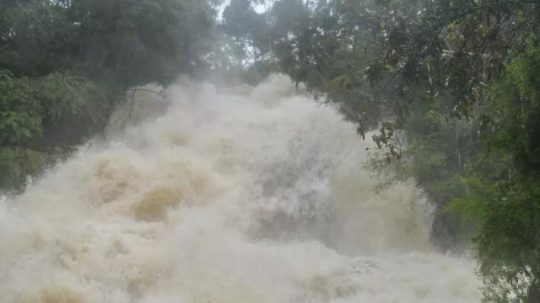
 

Katoomba Cascades during full flood, situated about 100 metres downstream of the pollution trap.  [SOURCE: Photo by Brigitte Grant, in article ‘Flood photos: Three-day drenching’ 22nd March 2021, Blue Mountains Gazette newspaper]
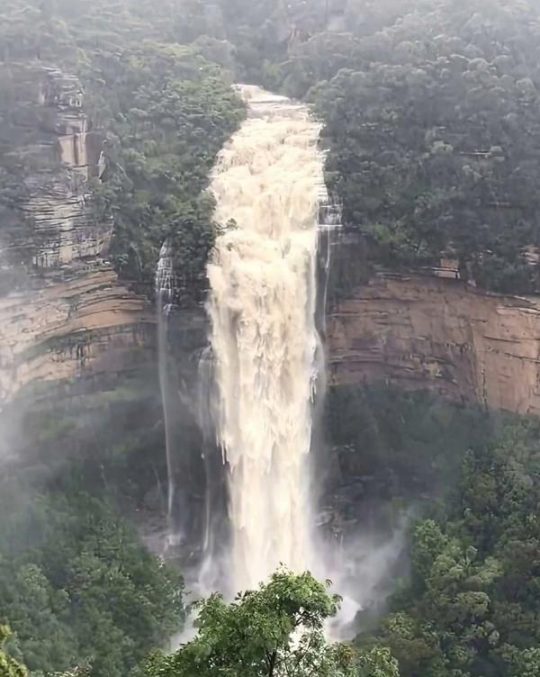
 

Katoomba Falls in full flood after days of heavy rain.  The falls are situated about 300 metres downstream of the pollution trap.  [SOURCE: Photographer unknown, in article ‘Police to co-ordinate evacuation of visitors trapped in Megalong Valley following landslip’ 4th April 2024, by Damien Madigan in  Blue Mountains Gazette newspaper] 


By the way, Upper Mountains sewage design (Katoomba, Leura, Wentworth Falls) back between 1907 and the 1990’s also flowed by iron piping down into the Jamison Valley to the former Leura Sewage Treatment Plant (historic image below) situated just by Leura Falls Creek between Echo Point and Sublime Point.   The iron piping still can be seen along hiking tracks down the escarpment – the reason for the hiking tracks actually being first constructed. 

We estimate that the current sand quantity filling this particular Creek Pollution Trap would be twenty cubic metres at least.  We reported the problem to Council the day we took the first photo above – receiving Council’s Customer Service Request reference #533082.

We’re not the only locals having noticed this particular in-creek pollution trap full.  Here’s another documented event of the very same pollution trap in February 2020.  It was during the start of Australia’s East Coast Low events associated with the La Niña oscillating weather pattern:
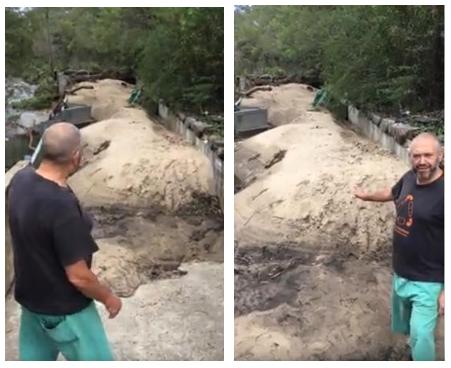
Local Blue Mountains Aboriginal Gundungurra Elder, Mr David King, posting his video on Google YouTube protesting this exact same problem back in 2020. He even likened it Bondi Beach!    [SOURCE]

This pollution trap’s exact location is situated beside Cliff Drive in Katoomba on the southern (downstream) side of the road at the road culvert over Katoomba Falls Creek.  See the aerial photographic map below showing the yellow star.  
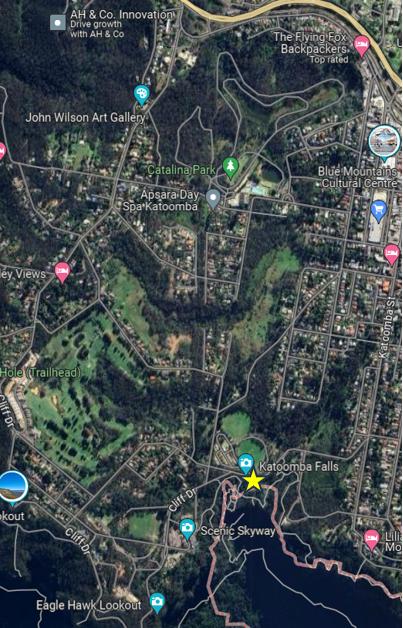
An aerial photo of the 100 ha extent of The Gully Water Catchment juxtaposed upstream of this pollution trap.  (NB. The “Katoomba Falls” photo label is incorrectly shown on this image, being rather just a Google nominal reference on the roadside.  [SOURCE: Google Maps aerial photo, 2024]


This in-creek pollution trap was constructed by Baramy Engineering Pty Ltd of Katoomba for Council.   
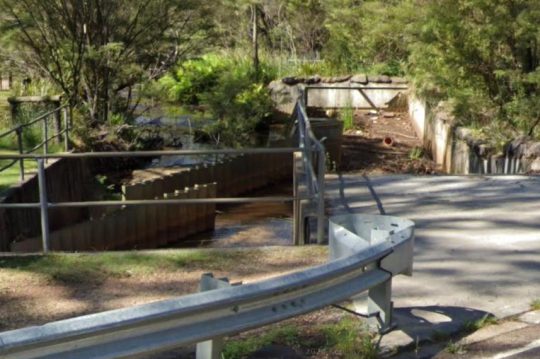
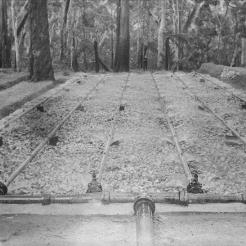
The Baramy Vane Trap showing the two rows of vertical galvanised steel vanes in the creek line that divert debris to the concrete trap device on the right.


The construction timing was a few years or so following The Greater Blue Mountains Area (1 million km2) being inscribed on the UNESCO World Heritage list on 29th November 2000.   Katoomba Falls flows into the Jamison Valley within this World Heritage area.  The Jamison Valley, below these falls (and others) is also part of the drinking water catchment leading to Warragamba Dam supplying an ever-expanding Greater Sydney (current population approaching 5.5 million) adjoining the Blue Mountains region.   

It is the researched opinion of The Habitat Advocate that this World Heritage listing was more about the human utility of protecting the value of Sydney’s drinking water in perpetuity, than it was about protecting the Eucalyptus forests of the Blue Mountains. 
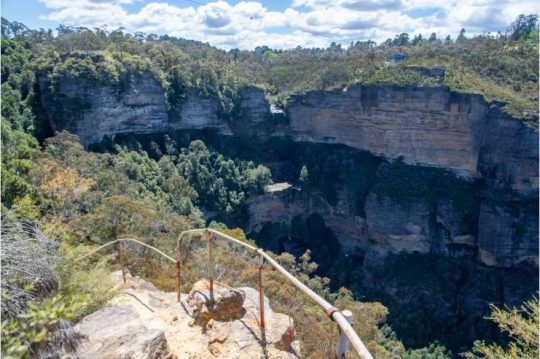
Katoomba Falls in the centre of this photo.  The Gully Water Catchment  upstream feeds natural and stormwater to these falls.  The area covers an estimated 100 hectares a passes through a small valley up on the Blue Mountains plateau. This valley includes bushland and increasingly more and more housing development.


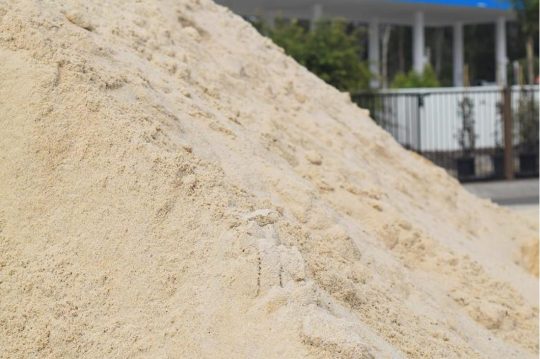
Notably, the sand type in this pollution trap appears to be not the naturally river sand, but consistently all the same light colour of Concrete Sand type used commercially in construction.


Concrete Sand


Concrete Sand is a coarser sand variety, pivotal in construction use to create strong and durable concrete structures.  It’s typically made from crushed quartz, which gives it a rougher texture, enhancing the binding properties in concrete mixtures. This sand type is indispensable for laying robust foundations, constructing driveways, and forming sidewalks.  This is exactly what is going on in The Gully Catchment upstream of this creek pollution trap.

Whereas the natural creek-bed of Katoomba Falls Creek is comprised of small pebbles.  This editor knows this from being local to Katoomba Falls Creek Valley and having voluntarily performed Streamwatch quality monitoring of Katoomba Falls Creek for five years (2004-2008) on behalf of the Friends of Katoomba Falls Creek Valley, Inc. reporting to the Sydney Catchment Authority (SCA) within the New South Wales Governments Sydney Water department. 
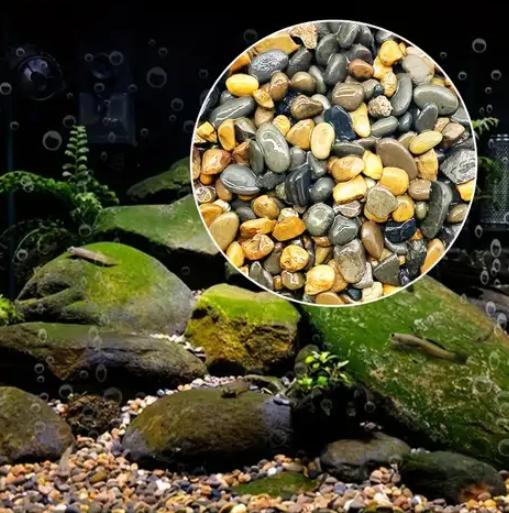
An example of the characteristics of creek-bed pebbles typically found naturally on the creek bed of Katoomba Falls Creek and other nearby watercourses – yet sadly beneath the years of construction sand sedimentation pollution from various identified housing construction sites throughout this plateaued catchment.


Council doesn’t analyse the sand to determine its source.  Council doesn’t fine the polluters and issue a stop work court order.  Council doesn’t employ a hydrologist or geotechnical engineer on its books.     Yet where is all the housing constrution taking place in the Blue Mountains?   Upstream of the World Heritage area.

In our view, Council is unfit in delegated stewardship as custodian of the geographic plateau of the Blue Mountains Local Government Area (LGA) atop the Blue Mountains World Heritage Area from its atrocious record of failings.   So long as this pollution control device is full and overflowing, sand and debris is flowing downstream over Katoomba Cascades and Katoomba Falls into the Kedumba River.   Parks Service (‘NPWS’) doesn’t monitor pollution levels or water quality in Kedumba River down in the Jamison Valley.

Council doesn’t enforce sediment controls are housing development sites upstream in The Gully Water Catchment (Katoomba Falls Creek Valley).

There are current two large housing subdivision sites contribution to sedimentation of the creek.


1.  Katoomba Golf Course – ‘Yarrabee Katoomba’ – a 24 townhouse subdivision
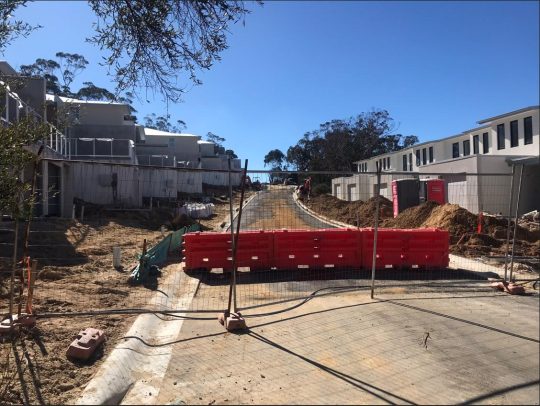
Totally inadequate sediment controls.   These townhouses are constructed of concrete using concrete sand.   [Photo by Editor, Sunday 26th May 2024]
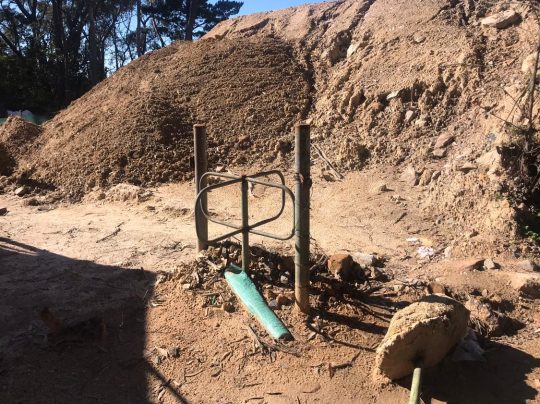
 

What sediment controls for this massive pile we’ve dubbed ‘The Sphynx’?  [Photo by Editor, Sunday 26th May 2024]


2.    21 Stuarts Road, Katoomba – massive housing subdivision

Some 13 odd hectares of fragile native bush surrounding an upland brook between Stuarts & Wellington Roads is to be bulldozed into a 53 cluster housing subdivision.
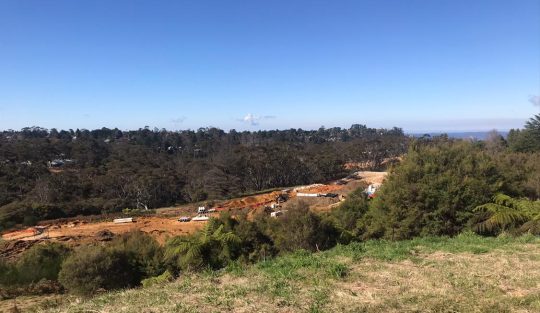
 

Bulldozing all the top soil throughout this side creek valley to Katoomba Falls Creek (Kedumba River).   [Photo by Editor, Sunday 26th May 2024]


Council care factor?   Zilch.


References:


[1]   ‘Concrete Sand: Essential for Structural Integrity’, ^https://www.constructor.net.au/breaking-down-the-different-types-of-sand-used-in-construction/


[2]   ‘Flood photos: Three-day drenching‘,  2021-03-24, Blue Mountains Gazette, ^https://www.bluemountainsgazette.com.au/story/7178181/flood-photos-three-day-drenching/


[3]   ‘Police to co-ordinate evacuation of visitors trapped in Megalong Valley following landslip‘, 2024-04-04, by Damien Madigan, Blue Mountains Gazette, ^https://www.bluemountainsgazette.com.au/story/8580550/blue-mountains-flash-flooding-warning-ses/


[4] Katoomba Baramy Trap‘, Maple Grove Reserve, February 2020, video by David King, ^https://www.facebook.com/dingodarbo/videos/maple-grove-reserve-katoomba-baramy-trap-february-2020/783187302176658/?_rdr


[5]   ‘Pollution Control Device‘ quote prepared for ‘Frank Walford Park Bushcare’ (Friends of Katoomba Falls Creek Valley Inc), 2004-09-27, by Baramy Engineering Pty Ltd, 7 pages.


[6]    ‘Leura Sewage Treatment Works‘, by Ask Roz Blue Mountains, Tourist information centre, ^https://www.facebook.com/AskRozBlueMountains/posts/historic-snapshot-leura-sewage-treatment-works-what-were-they-thinking-if-you-ha/3724364867606906/
 

Causes of Queensland Floods: Government

Saturday, January 28th, 2012
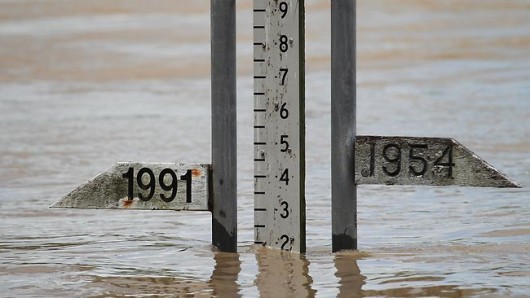
Queensland Flood Gauge – where have all the gauges gone? 
Removing them is as bad as burning books – history becomes dangerously forgotten.
Put ’em back!

.

Cyclone Yasi

.

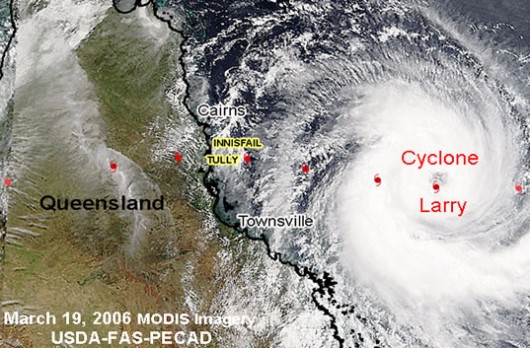
Far North Queensland experiences a recurring pattern of tropical cyclones during the Wet Season (Cyclone Winifred in 1986, Cyclone Rona in 1999, Cyclone Larry in 2006) – some being more damaging than others.  It is the luck of the draw, but should never be underestimated.

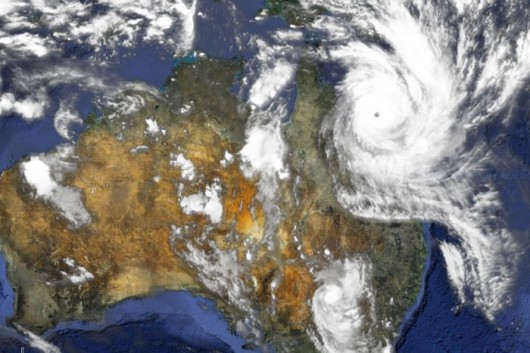
Cyclone Yasi in 2011, became severe category 5 cyclone by 1st February crossing the coast at Mission Beach bringing damaging winds of up to 290kph, torrential rain, flash flooding and 7 metre high sea storm surge.

I would not have wanted to have been there, recalling that twenty years ago in 1990 while working as a casual hotel porter, I happened to have been bunkered down in Cairns’ Four Seasons Hotel on the Esplanade, when Cyclone Joy loomed of the coast.  I recall the imminent sense of the cyclone’s force warned being beyond what authorities could cope with and so everyone was genuinely frightened.  The hotel’s lobby glass doors bowed inwards from the storm and I dont’ know why they didn’t break.

People that have not bunkered down in the path of an imminent cyclone cannot realise the fear of not knowing and what could happen – the prospect of death is real, people hug each other as a final gesture of humanity.  As it luckily turned out, Cyclone Joy fizzled into a widespread depression causing floods across Queensland.  To those at the time on the Cairns’ coast preapred to cop death, a torrential depression was nothing compared to what had been threatened.  We were alive!

Luck is spiritual, and convinced of having a guardian angel, I respect Nature and so have become very conservatively minded.  I once was in the Army, but I am a woos now.

Yasi delivered flooding rains inland as far as Mount Isa, Alice Springs and south into the Marray Darling basin.

The impact was mainly property and crop destruction (particularly sugar and banana), forests flattened, widespread power outage and water system failure centred around the coastal communities of Mission Beach, Tully, Silkwood, Innisfail and Cardwell.   Severe flooding cut the Bruce Highway between Townsville and Ingham and many inland communities (Oodnadatta, Glendambo and Anna Creek) became isolated.  One man died near Ingham.

The economic loss estimates from the storm were estimated to reach A$3.5 billion, including A$2 billion in agriculture, mining and local government, and A$1 billion in tourism.

The government response came from all three levels of government. The State’s combined emergency services were overwhelmed, so the Australian Government deployed the combined services of the Australian Defence Force under Operation Yasi Assist to aid civilian emergency response efforts with mainly transport logistics.  As a precaution, the RAAF provided aeromedical evacuations for 255 patients in Cairns Base Hospital and Cairns Private Hospital ahead of the cyclone.  Later emergency supplies had to be flown in to inland communities isolated by extensive flooding and many military personnel were engaged in debris removal.

The Queensland Premier, Anna Bligh, initiated the Premier’s Disaster Relief Appeal which ended up raising $281 million from inside the Australian community and from overseas donors. St. Vincent de Paul received $23 million which providing funds to over 2,464 affected households.

The Queensland Reconstruction Authority was established to develop, implement and manage a state wide plan for rebuilding and reconnecting communities affected by the floods and cyclones.  The restoration and recovery cost were estimated at $800 million, mainly to rebuild road and transport infrastructure.  This cost was borne 25% by the Queensland Givernment,and 75% by Australian Government.

Under the Australian Government’s dedicated Disaster Assist programme outlays for some 273,942 claims amounted to $310 million.

Northern Australia’s annual cyclone season – seen this before; nothing new

.

Queensland Floods

.

Over the summer of 2010-11, a series of torrential rain storms likely associated with the La Niña climate pattern over the Pacific as well as record-high ocean temperatures in the north-eastern Indian Ocean.

This climate pattern, alternating between the high risk flooding of La Niña and the prolonged droughts of El Niño is a well established weather pattern affecting particularly northern Australia.

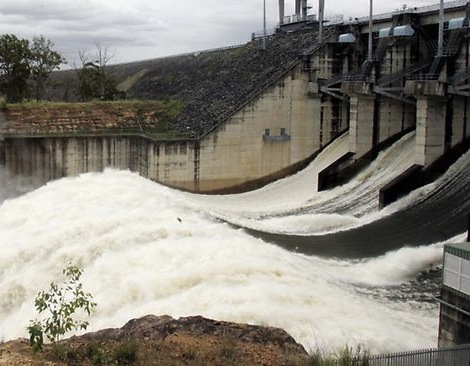
The Queensland Floods of 2011 affected the Fitzroy, Burnett, Condamine, Ballone, Mary, Brisbane and Bremer Rivers as well as Lockyer Creek and Oakey Creek (Toowoomba). An unexpected flash flood raced through Toowoomba’s central business district. Water from the same storm devastated communities in the Lockyer Valley. A few days later thousands of houses in Ipswich and Brisbane were inundated as the Brisbane River rose and Wivenhoe Dam used a considerable proportion of its flood mitigation capacity.

More than 70 towns were flooded, forcing evacuation of over 200,000 people.  Much of central and southern Queensland including Brisbane, Rockhampton, Emerald, Bundaberg, Dalby, Toowoomba, and Ipswich were inundated. More than 5900 insured homes were inundated in Brisbane and Ipswich when rivers erupted on 12th and 13th January 2011.   Three-quarters of the state of Queensland was declared a disaster zone.  There were 35 people confirmed dead and 9 missing. The damages bill was A$30 billion.

A large mobilisation of the Australian Defence Force was activated and a relief fund created. The head of the recovery taskforce was Major General Michael Slater, DSC, AM, CSC. The Queensland Reconstruction Authority was formed to co-ordinate the rebuilding program beyond the initial taskforce and a Commission of Inquiry established to investigate all matters related to the floods.

In figures released at the end of January 2011, the Insurance Council of Australia calculated that 38,460 individual claims were lodged with insurers which were worth A$1.51 billion. Nearly half of those claims were for damage to homes and more than half were made by those living in Brisbane.

With much of Queensland’s agriculture destroyed, the price of food across Australia rose, particularly fruits and vegetables and coal production slowed due to coal railway lines were closed and numerous mine sites being flooded.  The Australian Government is estimating an ultimate bill of $5.6 billion.

Australia’s recurring history of cyclones

.

  1. 1899 – CYCLONE MAHINA (Category 5)
  2. 1918 – CYCLONE MACKAY (Category 4)
  3. 1918 – CYCLONE INNISFAIL (Category 5)
  4. 1970 – CYCLONE ADA (Category 4)
  5. 1971 – CYCLONE ALTHEA (Category 4)
  6. 1972 – CYCLONE EMILY (Category 2)
  7. 1974 – CYCLONE TRACY (Category 4)
  8. 1975 – CYCLONE JOAN (Category 5)
  9. 1978 – CYCLONE ALBY (Category 4)
  10. 1986 – CYCLONE WINIFRED (Category 3)
  11. 1989 – CYCLONE ORSON (Category 4)
  12. 1995 – CYCLONE BOBBY (Category 4)
  13. 1997 – CYCLONE JUSTIN (Category 3)
  14. 2005 – CYCLONE INGRID (Category 4/5)
  15. 2006 – CYCLONE LARRY (Category 4)
  16. 2006 – Cyclone Larry (Category 4)
  17. 2007 – CYCLONE GEORGE (Category 5)
  18. 2011 – CYCLONE YASI (Category 5)

.

Notice any trend?     They tend to come in La Niña waves.

.

Indirect Causes of the 2010-11 Queensland Floods

.

1.  Category 5 Cyclone Yasi – cyclones are a frequent occurrence in Far North Queensland during the Wet  (November to March)
2.  The known prevailing La Niña climate pattern affecting Australia generally, worsening with known trends in climate change
3.  Widespread torrential rain storms causing localised flooding
4.  The creating and design of artificial storage dams on major rivers altering the natural river flows – Wivenhoe Dam on the Brisbane River
5.  Deforestation denying tree transpiration to take up much of the surface water, exacerbating surface runoff causing flooding of rivers and creeks regionally
6.  Human population settlements situated in known flood-prone land, encouraged by urban planning, land use development and housing approvals, thus with heightened exposure to periodic storm flood. Why were areas developed when people knew it was flood-prone?  What planning laws were ignored by Local and State governments to allow housing approvals in low-lying areas prone to flood and storm surge, indeed withaq recurring history of flooding?  The CSIRO has found that 32,500 homes in Queensland’s thickly settled southeast are exposed to a 2.5m storm tide, risking damage of $1.1 billion – by the time today’s babies leave school, in 2030, the number of homes at risk will be 61,500, at a potential cost of of $2bn in today’s dollars.   Local and State governments have forgotten about flooding and permitted too much development in danger zones on the sea front and in flood plains.
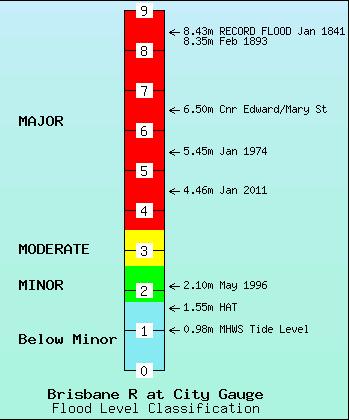
7.  Human population settlements situated in known sea surge -prone land, encouraged by urban planning, land use development and housing approvals, , thus with heightened exposure to periodic storm flood.  It is not as if Brisbane has no precedent for flood – look at 1893 and 1974!
8.  Local government land use development legislation allowing and facilitating building on flood-prone land
9.  Greedy developers profiting from property sales and development on land having a known recurring record of storm flood and surge risk
10.  Local, State and National governments turning a blind eye to mitigate the impacts of recurring storms in known areas that have and continue to cause flooding, damaging winds and coastal inundation.

Widespread deforestation of riverine valleys including their steep upper reaches
removes vital native forest cover denying natural transpiration
and so exacerbates local surface runoff and consequential regional flash flooding

.

Direct and Culpable Causes of the Queensland Floods Impact

.

1.  The delayed timing of the water overflow release from Wivenhoe Dam that directly caused the Brisbane River flooding
2.  State government failure to assess the effectiveness of home and contents  insurance coverage of property owners located in known flood prone and storm surge areas and failure to proactively address the shortcomings of this risk ahead of such disasters.   The Insurance Council has estimated the damage from flooding and cyclones in Queensland amounts to $2 billion — modelling emerged to show how vulnerable the country is to extreme weather.
3.  Local, State and National governments failure to undertake adequate risk assessment for disaster management, especially in areas having a recurring history of cyclones, torrential rains, riverine flooding, flash floods, storm surges and coastal inundation.   Where is Queensland’s, indeed Northern Australia’s disaster preparedness and resilience plan?  It needs to factor in all the Dorothea MacKeller terror scenarios.
4.  Failure by the Queensland Government to utilise the Brisbane River’s Wivenhoe Dam for its intended purpose – flood mitigation, not water storage
5.  Operational failure by the Queensland Government to release water ahead of know heavy rain period during the known high risk La Niña climate pattern in the height of summer at a time of ongoing torrential rains
6.  Failure to listen to prior warning from the Australian Bureau of Meteorology about the heightened risk from La Niña and for State, Local and National Governements to prepare and respond accordingly
7.  Failure by State and National governments to provide appropriate infrastructure situated and designed to withstand flash flooding events, storm surges and damaging winds. Power lines are still placed above ground making critical power supply susceptible to damaging winds causing widespread power outages.  Why are critical facilities such as public hospitals and evacuation/emergency relief centres not located safely beyond the effects of flood, and storm surges and coastal inundation?
8.  Failure by State and National governments to provide for emergency contingency and a sufficiently resources response.  Natural disasters such as torrential flooding rain and cyclones are not preventable but in Queensland are a know recurrence.  Their impact and cost is compounded by poor planning decisions and unheeded warnings.  Queensland’s disaster contingency preparation is woeful.Emergency services were stretched to the limit nationally, hence the Australian Defence Force was called in – a desperate last resort.  The Australian Defence Force is primarily trained, equipped and prepared for military emergencies, not civil emergencies such as natural disasters, so the  response was suboptimal.  What is the capacity, training and state of readiness of Defence Forces to cope with civil disasters at home, let alone in our region?
9.  Recurring failure by local, State and national governments to collectively learn from past natural disasters, to adopt and implement the recommendations from previous reports and enquiries into natural disasters across Queensland, and to consider and implement world’s best practice solutions.
10.  Recurring failure by local, State and national governments to accordingly budget for and to allocate  sufficient capital and recurrent funding to ensure timely outcomes
11.  Greedy insurance companies denying claims payments because of discretionary interpretation of home and contents insurance clauses.

Brisbane River Flood History

.

Government Responsibility

.

What do we vote in and pay our politicians for?  Is it to represent our collective interests, deliver on election promises and to get done the job of government or is it speech writing and popularism?

The incumbent US President Barack Obama rode to power in 2008 on the basis of good speech writing and delivery and on the back of an incompetent, dysfunction Bush Government embroiled in warmongering on false pretences and corrupt involvement by Halliburton, $300 billion in Defence excesses, a failed health care system, a $455 billion deficit, a widened wealth gap and condoning torture at Guantanimo. Arguably at the time, Obama piggybacked on the popular mandate for change when almost anyone was going to better than the Republicans arrogant clown from Texas, George W.

Obama in his speeches to win office inspired and promised. On the night before the 2008 presidential election on 3rd November 2008, Obama declared:

“I come away with an unyielding belief that if we only had a government as responsible as all of you, as compassionate as the American people, that there is no obstacle that we can’t overcome. There is no destiny that we cannot fulfill.”  “Tomorrow you can choose policies that invest in our middle class, create new jobs and grow this economy so that everybody has a chance to succeed.”
.
Then he went full-blown American, ranting on about “this defining moment in history“, “this is where change begins“, “the men and women who serve on our battlefields..(who) fought together and they bled together…some die together under the same proud flag, “yes we can“, blah, blah, blah.

Four years later in 2012, Obamba’s policies have added $1.4 trillion to US national debt, the U.S. credit rating has been downgraded to AA+, unemployment is still over 8%, the US strategic war in Afghanistan is still going, healthcare is still unaffordable to most Americans, and Gitmo is still open for business.  Obama has spent a record $12.8 trillion bailing out failed banks, mortgage lenders and car manufacturers.  To a degree, the  Republican Party’s ‘no we won’t‘ party political recalcitrance, stymieing US Congress decision making, has stiffled Obama’s ‘yes we can‘ delivery.  The politics is stifling the country.

.

Back in Australia, at the height of the combined calamities afflicting Queensland by Cyclone Yasi, regional flooding and the Brisbane River flood; on 13th January 2011 Labor Premier Anna Bligh gave a short media conference, now famously referred to as her ‘We are Queenslanders‘ speech.

“As we weep for what we have lost, and as we grieve for family and friends and we confront the challenge that is before us, I want us to remember who we are,” she said. “We are Queenslanders. We are the people they breed tough north of the border. We’re the ones that they knock down, and we get up again.

“I said earlier this week that this weather may break our hearts, and it is doing that. But it will not break our will. And in the coming weeks and the coming months we are going prove that beyond any doubt. Together we can pull through this, and with your help, we can achieve it.”

[Source: ‘Blighs tearfilled cry we are queenslanders’, by Megan Levy, 20110113, ^http://www.brisbanetimes.com.au/environment/weather/blighs-tearfilled-cry-we-are-queenslanders-20110113-19oxt.html]
.

Spare us!

In such crises, people look to their government for leadership, security and resources.  At other times, people have a right to expect that their government will responsibly assess risks and prepare for contingencies in the event of crises. This necessarily involves appropriate contingency planning, infrastructure provision and resourcing of emergency management. It also involves appropriate and timely emergency response followed by recovery and rebuilding.  It also requires learning lessons and implementing appropriate measures to mitigate the impact of future crises. In Queensland’s case three are three levels of government and in 2011 both State and Federal Government were Labor.

Beyond stirring speeches how has the Bligh Government performed its duty as government?

[Source: ‘Summer of fury exposes planning failures‘ by Jamie Walker, Natasha Bita, Jared Owens, The Australian, 20110212, ^http://www.theaustralian.com.au/news/nation/summer-of-fury-exposes-planning-failures/story-e6frg6nf-1226004691620]
.
We are Queenslanders – we opened the flood gates at the wrong time – sorry.

.

Katoomba’s Aquatic Centre drains to where?

Wednesday, October 5th, 2011

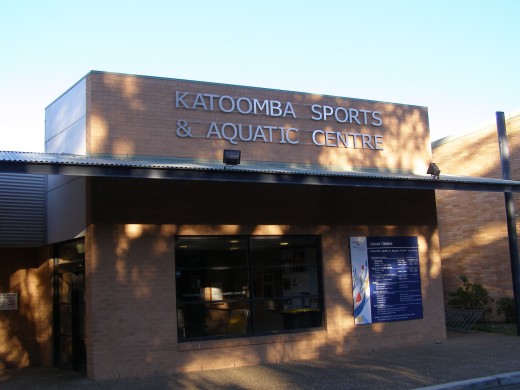
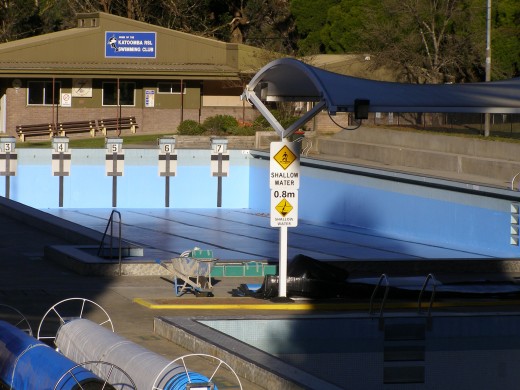
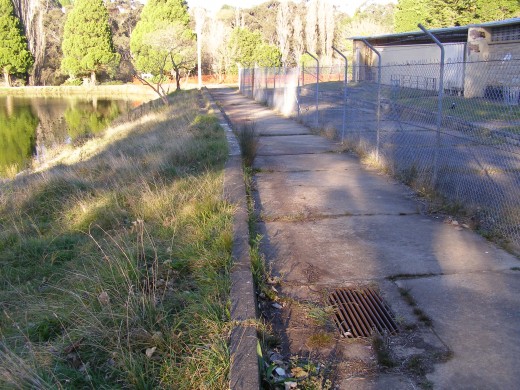
Every year after summer and upon the onset of winter, the outdoor pool at Katoomba Sports and Aquatic Centre, situated in Central Blue Mountains, is drained.  Its contents including the chlorine (likely sodium hypochlorite) is emptied.  The adjacent old plumbing between the pool and the dam, as well as repeated conductivity tests by the editor over multiple years under the Sydney Catchment Authority Streamwatch Programme point to the drainage being into the adjacent dam and into the Kedumba River; not into the sewer..

Reports of extreme water conductivity (off the scale… 500+ micro Siemens/cm) in the dam immediately following the draining the pool scale were sent to the Sydney Catchment Authority (SCA) , but nothing was ever done about it by the SCA.

This means every year, thousands of litres of chlorinated pool water flushes over Katoomba Falls and along the Kedumba River through the Greater Blue Mountains World Heritage Area.

It is therefore no surprise then that the Kedumba River looks clean – Blue Mountains Council ensures it is sterile of  macro-invertebrates and river life.

Katoomba Sports & Aquatic Centre
Blue Mountains, New South Wales, Australia

.

 
The Outdoor Pool of  the Aquatic Centre…drained every winter
(Photo by Editor 20110516, free in public domain)

.

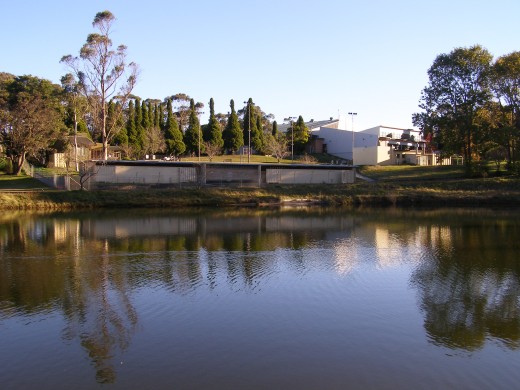
The Aquatic Centre was constructed conveniently adjacent to the Catalina Dam

.

Catalina  Dam, which in the late 1940s was glorified as a ‘lake’ by developer Horace Gates


(designed with a flotation levelling system interconnected to adjacent Katoomba Falls Creek)
 
 
.
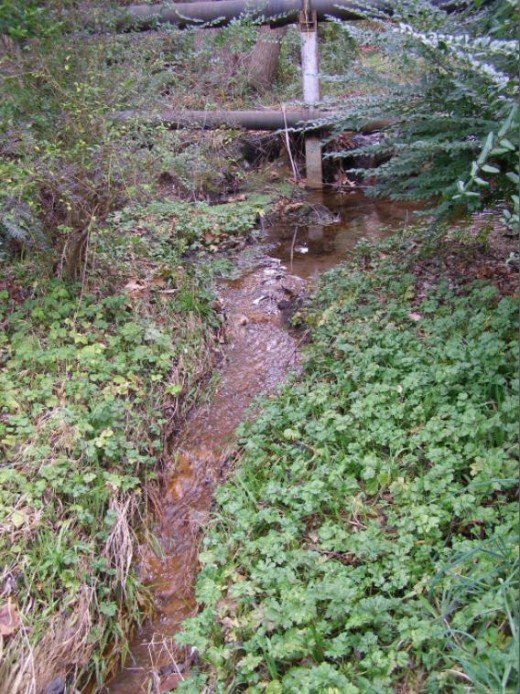
Upper Kedumba Creek downstream of Catalina Dam

.

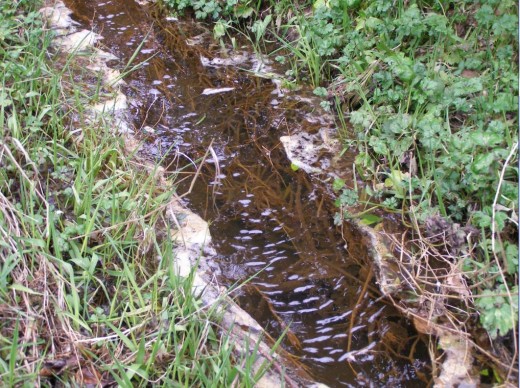
Upper Kedumba Creek downstream of Catalina Dam – close up

.

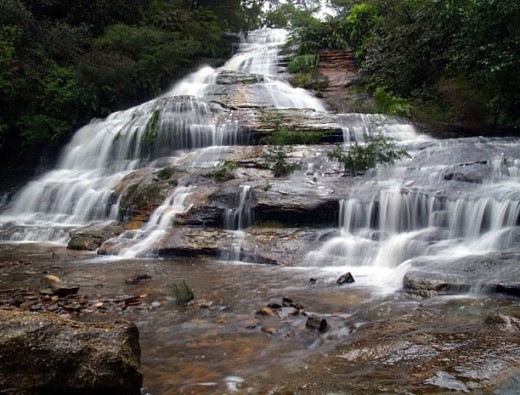
Katoomba Falls Creek naturally flows over Katoomba Falls

.

Katoomba Falls flows down the Blue Mountains escarpment into the Kedumba River

.

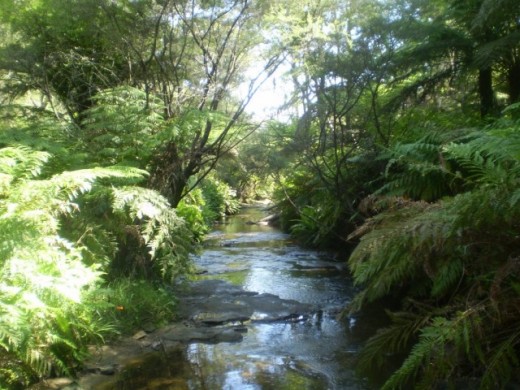
The Kedumba River flows through the Greater Blue Mountains World Heritage Area.


error: Content is copyright protected !!