Posts Tagged ‘spotted-tailed quoll’
Friday, March 30th, 2012
This article was initially written by this editor and published in the Blue Mountains Gazette newspaper on 20051005 as a letter to the editor, entitled ‘RFS strategy misguided‘.
.
 19th Century heritage-listed ‘Six Foot Track’
..bulldozed by the Rural Fire Service in July 2005, widened into a convenient Fire Trail for its fire truck crews. 19th Century heritage-listed ‘Six Foot Track’
..bulldozed by the Rural Fire Service in July 2005, widened into a convenient Fire Trail for its fire truck crews.
.
It has been revealed that the June bulldozing or grading of the Six Foot Track near Megalong Creek (Blue Mountains, New South Wales) was a mere drop in the Rural Fire Service (RFS) Bushfire Mitigation Programme.
Across the Blue Mountains, some twenty natural reserves including the Six Foot Track were targeted under the RFS 2004-05 Fire Trail Strategy:
- Edith Falls
- McMahons Point
- Back Creek
- Cripple Creek
- Plus some 95 hectares inside the Blue Mountains National Park.
.
Read: [>RFS Fire Trail Policy]
Read: [>RFS Fire Trail Classification Guidelines]
.
According to the Australian Government’s (then) Department of Transport and Regional Services (DOTARS) website, some $151,195 was granted to the RFS in the Blue Mountains alone, for it to bulldoze and burn 144 hectares of native bushland under the euphemism of “addressing bushfire mitigation risk priorities” (Ed: Read ‘bush arson‘)
‘The Six Foot Track Conservation and Management Plan 1997, Vol II’ lists numerous vulnerable species of fauna recorded near Megalong Creek – the Glossy Black-Cockatoo (Clyptorhynchus lathami), Giant Burrowing Frog (Heleioporus australiacus), Spotted-tailed Quoll (Dasyurus maculatus).
 Glossy Black-Cockatoo
[Source: Dubbo Field Naturalist & Conservation Society Glossy Black-Cockatoo
[Source: Dubbo Field Naturalist & Conservation Society
http://www.speednet.com.au/~abarca/black-cockatoo.htm]
.
") Giant Burrowing Frog
[Source: Frogs.org.au, ^http://frogs.org.au/community/viewtopic.php?t=4876&sid=0dc45ef08e12cd5e1d27524bca2269f9] Giant Burrowing Frog
[Source: Frogs.org.au, ^http://frogs.org.au/community/viewtopic.php?t=4876&sid=0dc45ef08e12cd5e1d27524bca2269f9]
.
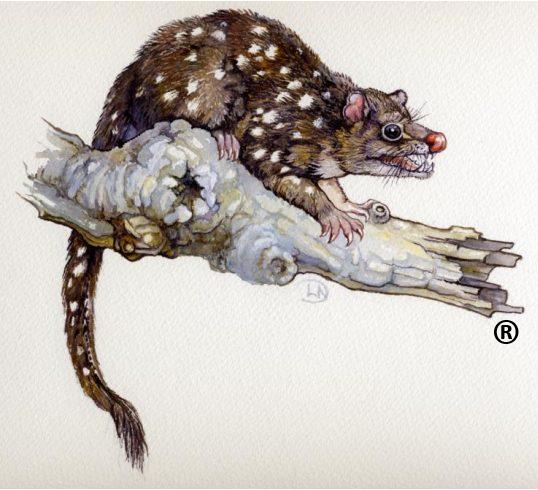
 Spotted-tailed Quoll
(Dasyurus maculatus)
Blue Mountains top order predator, competing with the Dingo Spotted-tailed Quoll
(Dasyurus maculatus)
Blue Mountains top order predator, competing with the Dingo
.
The RFS contractors wouldn’t have had a clue if they were within 100 metres or 1 metre of rare, vulnerable or threatened species.
The RFS is not exempt from destroying important ecological habitat; rather it is required to have regard to the principles of Ecologically Sustainable Development (ESD).
Read: >RFS Policy 2-03 Ecologically Sustainable Development
.
The ‘Rationale‘ of this RFS ESD policy states at Clause 1.2:
‘The Bush Fire Coordinating Committee, under the Rural Fires Act 1997 Sec 3 (d), is required to have regard to ESD as outlined in the Protection of the Environment Administration Act 1991, which sets out the following principles:
a) The precautionary principle namely, that if there are threats of serious or irreversible environmental damage, lack of full scientific certainty should not be used as a reason for postponing measures to prevent environmental degradation. In the application of the precautionary principle, public and private decisions should be guided by:
i. careful evaluation to avoid, wherever practicable, serious or irreversible damage to the environment, and
ii. an assessment of the risk-weighted consequences of various options.
.

b) Inter-generational equity namely, that the present generation should ensure that the health, diversity and productivity of the environment are maintained or enhanced for the benefit of future generations
.
.

c) Conservation of biological diversity and ecological integrity should be a fundamental consideration in all decisions.
.

d) Recognising the economic values that the natural environment provides. The natural environment has values that are often hard to quantify but provide a benefit to the entire community. By recognising that the natural environment does have significant economic and social values we can improve decision making for the present and future generations.’
.
 . .
Yet the RFS policy on hazard reduction is woefully loose in the ‘Bushfire Co-ordinating Committee Policy 2 /03 on ESD‘ – which (on paper) advocates protecting environmental values and ensuring that ESD commitments are adopted and adhered to by contractors.
Experience now confirms this policy is nothing more than ‘greenwashing’. The RFS wouldn’t know what environmental values were if they drove their fire truck into a Blkue Mountains upland swamp. There is not one ecologist among them.
While the critical value of dedicated RFS volunteer fire-fighters fighting fires is without question, what deserves questioning is the unsustainable response of the RFS ‘old guard’ to fire trails and hazard reduction with token regard for sensitive habitat. Repeated bushfire research confirms that bushfires are mostly now caused by:
- Bush arson (hazard reduction included, escaped or otherwise)
- More residential communities encroaching upon bushland.
.
Under the ‘Blue Mountains Bushfire Management Committee Bushfire Risk Management Plan’ (Ed: their bureaucratic name), key objectives are patently ignored:
- ‘Ensure that public and private land owners and occupiers understand their bushfire management responsibilities’
- ‘Ensure that the community is well informed about bushfire protection measures and prepared for bushfire events through Community Fireguard programs’
- ‘Manage bushfires for the protection and conservation of the natural, cultural, scenic and recreational features , including tourism values, of the area’.
.
Instead, the Rural Fire Service is content to look busy by burning and bulldozing native bushland. The RFS actively demonises native vegetation as a ‘fuel hazard‘, in the much the same way that ignorant colonists of the 18th and 19th centuries demonised Australia’s unique wildlife as ‘vermin‘ and ‘game‘.
.
Further Reading:
.
[1] Previous article on The Habitat Advocate: ‘ RFS Bulldozes Six Foot Track‘ (published 20101220): [> Read Article]
.
[2] Tip of the Bush-Arson Iceberg
What these government funded and State-sanctioned bush-arsonists get up to, deliberately setting fire to wildlife habitat, is an ecological disgrace.
The following list is from just 2005 of the vast areas of native vegetation deliberately burnt across New South Wales in just this one year. [Source: DOTARS].
Not surprisingly, this State-sanctioned bush-arson information is no longer published by government each year for obvious clandestine reasons, as the bush-arson continues out of the public eye.
The hazard reduction cult is similarly perpetuated across other Australian states – Victoria, Queensland, South Australia, Tasmania, West Australia as well as Northern Territory and the ACT. No wonder Australia’s record of wildlife extinctions tragically leads the world! There is little precious rich wildlife habitat left.
.
National Park and Wildlife Service (NSW) Bush Arson:
(Note: ‘NR’ = Nature Reserve, ‘NP’ = National Park, ‘SCA’ = State Conservation Area… as if these bastards care)
| Reserve / Activity Name |
Treatment Area (km2) |
| Baalingen NR |
5 |
| Baalingen NR |
6 |
| Bald Rock NP |
7 |
| Banyabba NR |
0.5 |
| BANYABBA NR |
3 |
| BANYABBA NR |
24 |
| BANYABBA NR |
8 |
| Barakee NP |
6 |
| Barool NP |
20 |
| Barool NP |
6 |
| Barool NP |
5 |
| Barool NP |
4 |
| Barool NP |
2 |
| Barool NP |
5 |
| Barrington Tops NP |
2.5 |
| Barrington Tops NP |
2 |
| Barrington Tops NP |
6 |
| Barrington Tops NP |
18 |
| Barrington Tops NP |
6 |
| Barrington Tops NP |
16 |
| Barrington Tops NP |
11 |
| Barrington Tops NP |
1 |
| Barrington Tops NP |
4 |
| Barrington Tops NP |
2 |
| Barrington Tops NP |
1 |
| Barrington Tops NP |
3 |
| Basket Swamp NP |
1 |
| Basket Swamp NP |
12 |
| Basket Swamp NP |
2 |
| Basket Swamp NP |
4 |
| Bellinger River NP |
1 |
| Ben Boyd NP |
0.8 |
| Ben Boyd NP |
3 |
| Ben Boyd NP |
0.9 |
| Ben Boyd NP |
0.9 |
| Ben Boyd NP |
5 |
| Ben Boyd NP |
13 |
| Ben Boyd NP |
5 |
| Ben Boyd NP |
0.4 |
| Ben Boyd NP |
1 |
| Ben Boyd NP |
2 |
| Ben Boyd NP |
3 |
| Ben Boyd NP |
5 |
| Ben Boyd NP |
3.6 |
| Ben Boyd NP |
1.9 |
| Ben Boyd NP |
1.6 |
| Ben Halls Gap NP |
3 |
| Bindarri NP |
2 |
| Black Bulga SCA |
8 |
| Black Bulga SCA |
12 |
| Black Bulga SCA |
21 |
| Blue Mountains NP |
42 |
| Blue Mountains NP |
8.3 |
| Blue Mountains NP |
23 |
| Blue Mountains NP |
10 |
| Blue Mountains NP |
12 |
| Bogendyra NR |
|
| Bolivia NR |
1 |
| BOLLONOLLA NR |
2 |
| Bondi Gulf NR |
8 |
| Bondi Gulf NR |
6 |
| Bondi Gulf NR |
10 |
| BONGIL BONGIL NP |
0.3 |
| BONGIL BONGIL NP |
0.5 |
| Boonoo Boonoo NP |
9 |
| Boonoo Boonoo NP |
10 |
| Booti Booti NP |
0.5 |
| Booti Booti NP |
0.3 |
| Booti Booti NP |
3 |
| Booti Booti NP |
0.3 |
| Booti Booti NP |
3 |
| Border Range NP |
6 |
| Border Ranges NP |
4 |
| Border Ranges NP |
3 |
| Border Ranges NP |
4 |
| Border Ranges NP |
2.8 |
| Bouddi NP |
0.5 |
| Bouddi NP |
0.3 |
| Bouddi NP |
0.9 |
| Bouddi NP |
0.9 |
| Bouddi NP |
0.5 |
| Bouddi NP |
1.1 |
| Bouddi NP |
0.5 |
| Bouddi NP |
1.9 |
| Bouddi NP |
1.1 |
| Bouddi NP |
0.6 |
| Bouddi NP |
2.3 |
| Bournda NR |
10 |
| Bournda NR |
5 |
| Bournda NR |
0.5 |
| Bournda NR |
0.5 |
| Bournda NR |
0.5 |
| Brindabella NP |
20 |
| Brisbane Water NP |
4.4 |
| Brisbane Water NP |
2.4 |
| Brisbane Water NP |
3.7 |
| Brisbane Water NP |
3.6 |
| Brisbane Water NP |
0.3 |
| Brisbane Water NP |
3.1 |
| Brisbane Water NP |
0.6 |
| Budawang NP |
4.8 |
| Budderoo NP |
10 |
| Bugong NP |
3.1 |
| Bundgalung NP |
2 |
| BUNDJALUNG NP |
7 |
| BUNDJALUNG NP |
4.5 |
| BUNDJALUNG NP |
8 |
| BUNDJALUNG NP |
1.5 |
| BUNDJALUNG NP |
0.5 |
| BUNDJALUNG NP |
6 |
| BUNDJALUNG NP |
3 |
| BUNDJALUNG NP |
3 |
| BUNDJALUNG NP |
4 |
| BUNDJALUNG NP |
2 |
| BUNDJALUNG NP |
1 |
| Bundundah Reserve |
1.94 |
| Bundundah Reserve/Morton NP |
4.7 |
| Bungawalbyn NP |
2 |
| Bungawalbyn NP |
2.25 |
| Bungawalbyn NP |
4 |
| Bungawalbyn NP |
5 |
| Bungawalbyn NP |
3 |
| Bungawalbyn NP |
4.5 |
| Bungawalbyn NP |
6.5 |
| Bungawalbyn NP |
5 |
| Bungawalbyn NP |
1.65 |
| Bungawalbyn NP |
1.5 |
| Burnt Down Scrub NR |
2 |
| Burnt School NR |
2 |
| Burrinjuck NR |
8 |
| Burrinjuck NR |
15 |
| Burrinjuck NR |
3 |
| Butterleaf NP |
|
| Butterleaf NP |
3 |
| Butterleaf NP |
3.2 |
| Butterleaf NP |
1.2 |
| Butterleaf NP |
1.6 |
| Butterleaf NP |
1.2 |
| Butterleaf NP |
2 |
| Butterleaf NP |
1.8 |
| Butterleaf NP |
1.4 |
| Butterleaf NP |
0.5 |
| Butterleaf NP |
2.3 |
| Butterleaf NP |
3.3 |
| Butterleaf NP |
3.9 |
| Butterleaf NP |
5.3 |
| Butterleaf NP |
0.4 |
| Butterleaf NP |
0.5 |
| Butterleaf NP |
1.5 |
| Butterleaf NP |
2.9 |
| Butterleaf NP |
5.3 |
| Butterleaf NP |
4 |
| Butterleaf NP |
3.3 |
| Butterleaf NP |
3.6 |
| Butterleaf NP |
1.5 |
| Butterleaf NP |
8.8 |
| Butterleaf NP |
0.5 |
| Capoompeta NP |
10 |
| Cataract NP |
|
| Cataract NP |
1.5 |
| Cataract NP |
2 |
| Cataract NP |
2 |
| Cataract NP |
1.5 |
| Cataract NP |
2 |
| Cataract NP |
1 |
| Clayton Chase |
5 |
| Clayton Chase |
10 |
| Clayton Chase |
3.5 |
| Clayton Chase |
4 |
| Clayton Chase |
3 |
| Clayton Chase |
3 |
| Clayton Chase |
4 |
| Conjola NP |
5.7 |
| Conjola NP |
1.8 |
| Conjola NP |
8.3 |
| Conjola NP |
4.8 |
| Conjola NP |
2.9 |
| Conjola NP |
4.5 |
| Conjola NP |
6.5 |
| Coolah Tops NR |
28 |
| Coolah Tops NR |
1 |
| Coolah Tops NR |
6 |
| Copeland Tops SCA |
3 |
| Copeland Tops SCA |
3.5 |
| Corramy SCA |
0.7 |
| Cottan-bimbang NP |
6 |
| Cottan-bimbang NP |
16 |
| Cottan-bimbang NP |
15 |
| Culgoa NP |
30 |
| Curramore NP |
|
| Curramore NP |
8 |
| Curramore NP |
8.9 |
| Curramore NP |
11 |
| Curramore NP |
5.5 |
| Dapper NR |
10 |
| Deua NP |
15.2 |
| Deua NP |
1.4 |
| Deua NP |
1 |
| Deua NP |
4 |
| Deua NP |
21.5 |
| Deua NP |
2.1 |
| Deua NP |
1.4 |
| Deua NP |
3.3 |
| Deua NP |
8.5 |
| Deua NP |
20.8 |
| Deua NP |
5.3 |
| Deua NP |
6.6 |
| Deua NP |
28.2 |
| Deua NP |
5.65 |
| DUNGGIR NP |
4 |
| Eurobodalla NP |
0.8 |
| Eurobodalla NP |
2.5 |
| Eurobodalla NP |
0.8 |
| Eurobodalla NP |
2.4 |
| Eurobodalla NP |
2 |
| Flaggy creek NR |
3 |
| Flaggy creek NR |
1.8 |
| GANAY NR |
2 |
| GANAY NR |
2 |
| Garawarra SCA |
|
| Garby NR |
2 |
| Gardens of Stone NP |
18 |
| Gibraltar NP |
14 |
| Goobang NP |
5 |
| Goobang NP |
25 |
| GUMBAYNGIR SCA |
12 |
| GUMBAYNGIR SCA |
7 |
| GUMBAYNGIR SCA |
6 |
| Ironbark NR |
13.5 |
| Jerrawangala NP |
6.83 |
| Jervis Bay NP |
2.37 |
| Jervis Bay NP |
5.42 |
| Jervis Bay NP |
0.56 |
| Jervis Bay NP |
0.82 |
| Jervis Bay NP |
1.45 |
| Jervis Bay NP |
1.72 |
| Jervis Bay NP |
0.21 |
| Jervis Bay NP |
0.32 |
| Jervis Bay NP |
0.7 |
| Jervis Bay NP |
0.4 |
| Jervis Bay NP |
0.35 |
| Jervis Bay NP |
0.35 |
| Jervis Bay NP |
0.48 |
| Jervis Bay NP |
1.03 |
| Jervis Bay NP |
0.65 |
| Jervis Bay NP |
1.91 |
| Jervis Bay NP |
0.34 |
| Jervis Bay NP |
0.95 |
| Jervis Bay NP |
1.46 |
| Jervis Bay NP |
0.71 |
| Jervis Bay NP |
1.07 |
| Jingellic NR |
20 |
| Karuah NR |
10 |
| Karuah NR |
28 |
| Karuah NR |
10 |
| Karuah NR |
12 |
| Karuah NR |
1 |
| Kings Plains NP |
7 |
| Kings Plains NP |
0 |
| Kings Plains NP |
4 |
| Koreelah NP |
6 |
| Kosciuszko NP |
30 |
| Kosciuszko NP |
9.5 |
| Kosciuszko NP |
22 |
| Kosciuszko NP |
22 |
| Kosciuszko NP |
33 |
| Kosciuszko NP |
33 |
| Kosciuszko NP |
33 |
| Kosciuszko NP |
12 |
| Kosciuszko NP |
12 |
| Kosciuszko NP |
17 |
| Kosciuszko NP |
5 |
| Kosciuszko NP |
28 |
| Kosciuszko NP |
9 |
| Kosciuszko NP |
6 |
| Kosciuszko NP |
6 |
| Kosciuszko NP |
26 |
| Kosciuszko NP |
8.9 |
| Kosciuszko NP |
15 |
| Kosciuszko NP |
15 |
| Kosciuszko NP |
2.5 |
| Kosciuszko NP |
8.9 |
| Kosciuszko NP |
10 |
| Kosciuszko NP |
11 |
| Kosciuszko NP |
4.8 |
| Kosciuszko NP |
18 |
| Kosciuszko NP |
19 |
| Kosciuszko NP |
7.2 |
| Kosciuszko NP |
7.2 |
| Kosciuszko NP |
13 |
| Kosciuszko NP |
18 |
| Kosciuszko NP |
33 |
| Kosciuszko NP |
33 |
| Kosciuszko NP |
18 |
| Kosciuszko NP |
18 |
| Kosciuszko NP |
15 |
| Kosciuszko NP |
12 |
| Kwiambal NP |
7 |
| Kwiambal NP |
3 |
| Kwiambal NP |
2 |
| Kwiambal NP |
2.25 |
| Lake Macquarie SCA |
0.3 |
| Lake Macquarie SCA |
0.4 |
| Lake Macquarie SCA |
0.4 |
| Lake Macquarie SCA |
0.4 |
| Ledknapper NR |
15 |
| Linton NR |
12.5 |
| Meroo NP |
2.4 |
| Meroo NP |
0.9 |
| Meroo NP |
0.6 |
| Meroo NP |
3.3 |
| Meroo NP |
3.9 |
| Meroo NP |
3.5 |
| Meroo NP |
0.5 |
| Morton NP |
5.9 |
| Morton NP |
8.3 |
| Morton NP |
3.8 |
| Morton NP |
6 |
| Morton NP |
13 |
| Morton NP |
0.4 |
| Morton NP |
4.5 |
| Morton NP |
5 |
| Morton NP |
2.7 |
| Morton NP |
0.7 |
| Morton NP |
2.1 |
| Morton NP |
1 |
| Morton NP |
6 |
| Mt Canobolas SCA |
1 |
| Mt Clunnie NP |
6.5 |
| Mt Dowling NR |
2 |
| MT NEVILLE NR |
11 |
| MT NEVILLE NR |
1 |
| MT NEVILLE NR |
1.5 |
| MT NEVILLE NR |
11 |
| MT NEVILLE NR |
1.5 |
| MT NEVILLE NR |
3.5 |
| MT PIKAPENE NP |
2 |
| MT PIKAPENE NP |
4 |
| MT PIKAPENE NP |
2.5 |
| MT PIKAPENE NP |
1.5 |
| MT PIKAPENE NP |
1.5 |
| MT PIKAPENE NP |
4 |
| MT PIKAPENE NP |
7 |
| MT PIKAPENE NP |
2 |
| MT PIKAPENE NP |
2.5 |
| MT PIKAPENE NP |
6 |
| MT PIKAPENE NP |
3 |
| MT PIKAPENE NP |
0.5 |
| MT PIKAPENE NP |
0.5 |
| MT PIKAPENE NP |
2.5 |
| MT PIKAPENE NP |
2 |
| MT PIKAPENE NP |
1 |
| MT PIKAPENE NP |
2.5 |
| MT PIKAPENE NP |
6 |
| MT PIKAPENE NP |
2 |
| MT PIKAPENE NP |
1 |
| MT PIKAPENE NP |
2.5 |
| MT PIKAPENE NP |
2 |
| MT PIKAPENE NP |
1.5 |
| Mummell Gulf NP |
3 |
| Mummell Gulf NP |
7 |
| Mummell Gulf NP |
5 |
| Munmorah SRA |
0.7 |
| Munmorah SRA |
0.8 |
| Munmorah SRA |
0.45 |
| Munmorah SRA |
1 |
| Munmorah SRA |
2 |
| Munmorah SRA |
0.9 |
| Munmorah SRA |
1.6 |
| Muogamarra NR |
1 |
| Murramarang NP |
0.9 |
| Murramarang NP |
8 |
| Murramarang NP |
1 |
| Murramarang NP |
5.1 |
| Murramarang NP |
8.2 |
| Murramarang NP |
3.1 |
| Murramarang NP |
6.8 |
| Murramarang NP |
16 |
| Murramarang NP |
4.3 |
| Murramarang NP |
4 |
| Myall Lakes NP |
5 |
| Myall Lakes NP |
5 |
| Myall Lakes NP |
1.5 |
| Myall Lakes NP |
2 |
| Myall Lakes NP |
1 |
| Myall Lakes NP |
5 |
| NGAMBAA NR |
2 |
| NGAMBAA NR |
5 |
| Nombinnie NR |
10 |
| Nymboida NP |
6 |
| Nymboida NP |
12 |
| Nymboida NP |
3 |
| Nymboida NP |
4 |
| Nymboida NP |
1 |
| Nymboida NP |
4 |
| Nymboida NP |
4 |
| Nymboida NP |
3.2 |
| Nymboida NP |
4.5 |
| Nymboida NP |
2 |
| Nymboida NP |
4 |
| Nymboida NP |
2.8 |
| Nymboida NP |
4.2 |
| Nymboida NP |
4.2 |
| Nymboida NP |
4.2 |
| Nymboida NP |
4.2 |
| Nymboida NP |
4.2 |
| Nymboida NP |
4.2 |
| Nymboida NP |
4.2 |
| Nymboida NP |
4.2 |
| Nymboida NP |
7 |
| Nymboida NP |
6 |
| Oxley Wild Rivers NP |
10.7 |
| Oxley Wild Rivers NP |
19.1 |
| Oxley Wild Rivers NP |
13.4 |
| Oxley Wild Rivers NP |
18 |
| Oxley Wild Rivers NP |
18 |
| Oxley Wild Rivers NP |
15 |
| Oxley Wild Rivers NP |
33 |
| Oxley Wild Rivers NP |
33 |
| Oxley Wild Rivers NP |
5 |
| Oxley Wild Rivers NP |
5 |
| Oxley Wild Rivers NP |
4 |
| Oxley Wild Rivers NP |
3 |
| Oxley Wild Rivers NP |
7 |
| Parma Creek NR |
0.21 |
| Parma Creek NR |
0.07 |
| Parma Creek NR |
0.3 |
| Parma Creek NR |
0.01 |
| Parma Creek NR |
0.29 |
| Parma Creek NR |
5 |
| Paroo Darling NP |
60 |
| Policemans Cap |
10 |
| Razorback NR |
17 |
| Richmond Range NP |
3.9 |
| Richmond Range NP |
6.5 |
| Richmond Range NP |
3.8 |
| Richmond Range NP |
4.5 |
| Richmond Range NP |
5.5 |
| Richmond Range NP |
9 |
| Royal NP |
1 |
| Seven Mile Beach NP |
1.09 |
| Seven Mile Beach NP |
1.79 |
| Seven Mile Beach NP |
2.24 |
| Seven Mile Beach NP |
0.74 |
| Seven Mile Beach NP |
2.03 |
| Severn River NR |
6 |
| Single NP |
21 |
| South East Forest NP |
5 |
| South East Forest NP |
1.2 |
| South East Forest NP |
1.2 |
| South East Forest NP |
2.6 |
| South East Forest NP |
3 |
| South East Forest NP |
10.9 |
| South East Forest NP |
1.3 |
| South East Forest NP |
1 |
| South East Forest NP |
1.2 |
| South East Forest NP |
2.8 |
| South East Forest NP |
2 |
| South East Forest NP |
1.2 |
| South East Forest NP |
2 |
| South East Forest NP |
5.1 |
| South East Forest NP |
3.5 |
| South East Forest NP |
0.5 |
| South East Forest NP |
6 |
| South East Forest NP |
3 |
| South East Forest NP |
1 |
| South East Forest NP |
5.5 |
| South East Forest NP |
0.8 |
| Stoney Batter NR |
6 |
| Tapitallee NR |
0.52 |
| Tapitallee NR |
0.33 |
| Tapitallee NR |
0.36 |
| Tapitallee NR |
0.32 |
| Tarlo River NP |
3.8 |
| Tarlo River NP |
2.1 |
| Tarlo River NP |
2.9 |
| Tarlo River NP |
5.9 |
| Tarlo River NP |
6.5 |
| Tarlo River NP |
2.7 |
| Tarlo River NP |
2.1 |
| Tarlo River NP |
6 |
| Tollingo NR |
150 |
| Tomaree NP |
1.8 |
| Tooloom NP |
3 |
| Toonumbar NP |
31.9 |
| Toonumbar NP |
8.5 |
| Toonumbar NP |
17 |
| Toonumbar NP |
21.5 |
| Triplarina NR |
0.71 |
| Triplarina NR |
0.32 |
| Triplarina NR |
0.66 |
| Triplarina NR |
0.75 |
| Triplarina NR |
1.34 |
| Triplarina NR |
0.31 |
| Triplarina NR |
1.24 |
| Triplarina NR |
1.35 |
| Ungazetted (Kalyarr NP) |
48 |
| Ungazetted (Kalyarr NP) |
26 |
| Unknown |
7 |
| Wa Hou NR |
10 |
| Wa Hou NR |
1 |
| Wa Hou NR |
7 |
| Wa Hou NR |
1 |
| Wa Hou NR |
11 |
| Wa Hou NR |
1 |
| Wa Hou NR |
7 |
| Wa Hou NR |
1 |
| Wa Hou NR |
1 |
| Wa Hou NR |
1 |
| Wa Hou NR |
1 |
| Wallaroo NR |
3 |
| Wallaroo NR |
1.5 |
| Wallaroo NR |
8 |
| Wallaroo NR |
5 |
| Wallaroo NR |
11 |
| Wallaroo NR |
7 |
| Wallaroo NR |
7 |
| Wallaroo NR |
16 |
| Wallaroo NR |
6 |
| Wallingat NP |
2 |
| Wallingat NP |
1.3 |
| Wallingat NP |
3.6 |
| Wallingat NP |
3.3 |
| Washpool Np |
18 |
| Washpool NP |
5.3 |
| Washpool NP |
5.6 |
| Washpool NP |
7.1 |
| Washpool NP |
6.4 |
| Washpool NP |
1.6 |
| Washpool NP |
7 |
| Washpool NP |
2.8 |
| Watson’s Creek NR |
5 |
| Wereboldera SCA |
9 |
| Woggoon NR |
144 |
| Wollemi NP |
21 |
| Wollemi NP |
12 |
| Wollemi NP |
10 |
| Wollemi NP |
30 |
| Wollemi NP |
7 |
| Wollemi NP |
11 |
| Wollemi NP |
7 |
| Wollemi NP |
16 |
| Wollemi NP |
2 |
| Wollemi NP |
8 |
| Wollemi NP |
5 |
| Woodford Island NR |
1.5 |
| Woodford Island NR |
2 |
| Woodford Island NR |
3 |
| Woodford Island NR |
3 |
| Woollamia NR |
1.51 |
| Woollamia NR |
0.77 |
| Woollamia NR |
1.95 |
| Woollamia NR |
1.88 |
| Woollamia NR |
0.74 |
| Woomargama NP |
15 |
| Yabbra NP |
8 |
| Yabbra NP |
45 |
| Yango NP |
0.45 |
| Yanununbeyan NP |
11 |
| YARRIABINNI NP |
2 |
| YARRIABINNI NP |
3 |
| YARRIABINNI NP |
5 |
| YARRIABINNI NP |
6 |
| YARRIABINNI NP |
4 |
| Yuraygir NP |
4 |
| Yuraygir NP |
3.5 |
| Yuraygir NP |
1 |
| Yuraygir NP |
1 |
| YURAYGIR NP |
0.03 |
| Yuraygir NP |
1 |
| Yuraygir NP |
3.5 |
| Yuraygir NP |
1.5 |
| Yuraygir NP |
1.5 |
| Yuraygir NP |
1.5 |
| Yuraygir NP |
1.5 |
| Yuraygir NP |
1.5 |
| Yuraygir NP |
1.5 |
| Yuraygir NP |
1.5 |
| Yuraygir NP |
1.5 |
| Yuraygir NP |
1.5 |
| Yuraygir NP |
1.5 |
| Yuraygir NP |
28 |
| Yuraygir NP |
10 |
| Yuraygir NP |
12 |
| Yuraygir NP |
1 |
| Yuraygir NP |
1 |
| Yuraygir NP |
4 |
| Yuraygir NP |
3.5 |
|
3,785.10 Ha |
i.e. An area 6km x 6km
.
NSW Local Government Areas (LGAs)
| Bush Fire Management Committee / LGA |
Reserve / Activity Name |
Treatment Area (km2) |
| Blue Mountains |
Northern Strategic Line -Primary |
8 |
| Blue Mountains |
De Faurs Trail – Mt Wilson -Primary |
2.8 |
| Blue Mountains |
Mitchell’s Creek Fire Trail – Primary |
3.5 |
| Blue Mountains |
Nellies Glen Fire Trail |
2.8 |
| Blue Mountains |
Back Creek Fire Trail – Primary |
3.2 |
| Blue Mountains |
Mt Piddington Trail – Hornes Point |
N/A |
| Bombala |
Gibraltar Ridge Fire Trail (2) (PT) |
20 |
| Bombala |
Mt Rixs Fire Trail (PT) |
6 |
| Bombala |
Roaring Camp Fire Trail (PT) |
12 |
| Cooma-Monaro |
Brest Fire Trail (2) (PT) |
15 |
| Cooma-Monaro |
Calabash Fire Trail (2) (PT) |
22 |
| Cooma-Monaro |
Murrumbucca Fire Trail (2) (ST) |
15 |
| Cooma-Monaro |
Bridge Fire Trail (2) (PT) |
6 |
| Cooma-Monaro |
Log In Hole Fire Trail (2) (PT) |
5 |
| Gloucester |
Upper Avon Fire Trail |
11 |
| Greater Argyle |
Mountain Ash Fire Trail |
10 |
| Greater Argyle |
Mootwingee Fire Trail |
6 |
| Greater Hume |
Murphy’s Fire Trail |
0.2 |
| Greater Hume |
Mandaring Fire Trail |
1 |
| Greater Queanbeyan City |
Queanbeyan River Fire Trail |
5.5 |
| Greater Queanbeyan City |
Gourock Fire Trail |
5.8 |
| Hawkesbury District |
Jacks Trail |
1.6 |
| Hawkesbury District |
Duffys Trail (2) ?tenure |
3 |
| Mallee |
Various Fire Trails |
N/A |
| Mallee |
No 21 Fire Trail |
20 |
| Namoi/Gwydir |
Warialda State Forest |
6.5 |
| Namoi/Gwydir |
Zaba-Kaiwarra-Kiora Fire Trail (check) |
10 |
| Namoi/Gwydr |
Blue Nobby Fire Trail (check) |
8 |
| Namoi/Gwydr |
Araluen Fire Trail (check) |
6 |
| Snowy River |
Snowy Plain Fire Trail (2) (PT) |
18 |
| Snowy River |
Crackenback Fire Trail (PT) |
10 |
| Snowy River |
Devils Hole Fire Trail (PT) |
18 |
| Snowy River |
Golden Age Fire Trail (2) (PT) |
8 |
| Sutherland |
Sabugal Pass Fire Trail |
N/A |
| SW Mallee |
Various Fire Trails |
N/A |
| SW Mallee |
Oberwells Fire Trail |
28 |
| SW Mallee |
Mandleman Fire Trail |
40 |
| Upper Lachlan |
Johnsons Creek Fire Trail |
15 |
| Warringah/Pittwater |
Lovett Bay Trail (2) |
2.5 |
| Warringah/Pittwater |
Elvina Bay Trail (2) |
1.5 |
| Yass Valley |
Nelanglo Fire Trail |
21 |
| Yass Valley |
Hayshed Fire Trail 1 |
7 |
| Yass Valley |
Hayshed Fire Trail 2 |
7 |
|
|
391.90 km2 |
i.e. An area 20km x 20km
.
Forests NSW (government’s industrial logger of NSW remnant forests).
(Forests NSW did not publish the area burnt, only the cost. As a rule of thumb use $3000/square km)
| Bush Fire Management Committee |
Reserve / Activity Name |
NSW
Allocation |
| Clarence Zone |
Dalmorton SF |
$30,000 |
| Future Forests |
Swan |
$20,050 |
| Future Forests |
Tindall |
$10,680 |
| Future Forests |
Tooloom |
$10,425 |
| Future Forests |
Mazzer |
$7,341 |
| Future Forests |
Kungurrabah |
$4,435 |
| Future Forests |
Morpeth Park |
$3,773 |
| Future Forests |
Loughnan |
$3,155 |
| Future Forests |
Inglebar |
$3,000 |
| Future Forests |
Lattimore |
$2,604 |
| Future Forests |
Byrne |
$1,755 |
| Future Forests |
Ziull 4 |
$1,677 |
| Future Forests |
Lejag |
$1,670 |
| Future Forests |
Ziull 2 |
$1,600 |
| Future Forests |
Bates |
$1,563 |
| Future Forests |
Ziull 3 |
$1,454 |
| Future Forests |
Envirocom |
$1,410 |
| Future Forests |
Morgan |
$1,361 |
| Future Forests |
McNamara |
$1,279 |
| Future Forests |
Neaves |
$967 |
| Future Forests |
Zuill |
$872 |
| Future Forests |
Boyle |
$807 |
| Future Forests |
Fitzpatrick |
$791 |
| Future Forests |
Morrow |
$785 |
| Future Forests |
Morrow |
$785 |
| Future Forests |
Morrow |
$785 |
| Future Forests |
Wallwork |
$665 |
| Future Forests |
Smith |
$665 |
| Future Forests |
Wilson |
$622 |
| Future Forests |
Jarramarumba |
$600 |
| Future Forests |
Hession |
$597 |
| Future Forests |
Edwards |
$563 |
| Future Forests |
Maunder |
$558 |
| Future Forests |
Kuantan |
$515 |
| Future Forests |
Billins |
$484 |
| Future Forests |
Cox |
$475 |
| Future Forests |
Paterson |
$461 |
| Future Forests |
Gladys |
$415 |
| Future Forests |
O’Keefe |
$371 |
| Future Forests |
Woodcock |
$369 |
| Future Forests |
Pratten |
$346 |
| Future Forests |
Truswell |
$323 |
| Future Forests |
Divine |
$323 |
| Future Forests |
Hastings |
$323 |
| Future Forests |
White |
$300 |
| Future Forests |
Miller |
$300 |
| Future Forests |
Koop |
$300 |
| Future Forests |
Lacy |
$277 |
| Future Forests |
Nosrac |
$277 |
| Future Forests |
Tully |
$277 |
| Future Forests |
Baker |
$277 |
| Future Forests |
Yaganegi |
$277 |
| Future Forests |
Siezowski |
$254 |
| Future Forests |
Zuill |
$254 |
| Future Forests |
Atcheson |
$254 |
| Future Forests |
Dissevelt |
$254 |
| Future Forests |
Hoy |
$254 |
| Future Forests |
Woods |
$254 |
| Future Forests |
Dawson |
$254 |
| Future Forests |
Hagan |
$254 |
| Future Forests |
Skelly |
$231 |
| Future Forests |
Robards |
$231 |
| Future Forests |
Maunder |
$231 |
| Future Forests |
Day |
$231 |
| Future Forests |
O’Connell |
$231 |
| Future Forests |
Kompara |
$231 |
| Future Forests |
Carmen |
$231 |
| Future Forests |
Maurer |
$231 |
| Future Forests |
Cunin |
$208 |
| Future Forests |
GCC |
$208 |
| Future Forests |
White |
$208 |
| Future Forests |
Hayer |
$208 |
| Future Forests |
Southgate |
$208 |
| Future Forests |
Peck |
$208 |
| Greater Taree |
Kiwarrak SF |
$40,000 |
| Hastings |
Cowarra SF |
$30,000 |
| Hastings |
Caincross SF |
$4,000 |
| Hume |
Clearing fire trails |
$100,000 |
| Hume |
New FT |
$6,000 |
| Hunter |
Pokolbin SF |
$13,600 |
| Hunter |
Myall River SF |
$12,800 |
| Hunter |
Myall River SF |
$12,800 |
| Hunter |
Heaton SF |
$12,400 |
| Hunter |
Bulahdelah SF |
$6,100 |
| Hunter |
Watagan SF |
$3,200 |
| Hunter |
Awaba SF |
$3,200 |
| Hunter |
Myall River SF |
$3,100 |
| Macquarie |
Warrengong |
$16,250 |
| Macquarie |
Vulcan & Gurnang |
$11,519 |
| Macquarie |
Kinross SF |
$8,800 |
| Macquarie |
Mount David |
$6,101 |
| Macquarie |
Newnes SF |
$5,199 |
| Macquarie |
Printing 25 fire atlas’ |
$2,048 |
| Macquarie |
Black Rock Ridge |
$447 |
| Mid-Nth Coast – Taree |
Knorrit SF |
$36,000 |
| Mid-Nth Coast – Taree |
Yarratt SF |
$16,000 |
| Mid-Nth Coast – Wauchope |
Boonanghi SF |
$37,000 |
| Mid-Nth Coast – Wauchope |
Northern Break |
$9,000 |
| Mid-Nth Coast – Wauchope |
Caincross SF |
$3,000 |
| Mid-Nth Coast – Wauchope |
Western Break |
$2,000 |
| Monaro |
Clearing fire trails |
$114,685 |
| North East |
Thumb Creek SF |
$46,000 |
| North East |
Candole SF |
$29,535 |
| North East |
Various State Forests |
$20,000 |
| North East |
Mt Belmore SF |
$12,115 |
| North East |
Candole SF |
$8,900 |
| North East |
Lower Bucca SF |
$5,500 |
| North East |
All North Region |
$3,300 |
| North East |
Wild Cattle SF |
$3,000 |
| North East |
Orara East SF |
$1,900 |
| Northern -Casino |
Barragunda |
$11,522 |
| Northern -Casino |
Yaraldi 2003 |
$8,847 |
| Northern -Casino |
Yaraldi 2004 |
$3,207 |
| Richmond Valley |
Bates |
$20,000 |
| Richmond Valley |
Whiporie SF |
$13,154 |
| Richmond Valley |
Swanson |
$12,000 |
| Richmond Valley |
McNamara |
$10,180 |
| Richmond Valley |
Whiporie SF |
$9,582 |
| Southern |
Pollwombra FT |
$6,360 |
| Southern-Eden |
Various – whole district |
$112,019 |
| Tamworth |
Nundle SF |
$40,000 |
| Walcha |
Nowendoc SF |
$30,000 |
| Walcha |
Styx River SF |
$20,000 |
|
|
$1,073,482 |
i.e. Approximately an area 20km x 20km
.
NSW Department of Lands (what native vegetation’s left).
| Bush Fire Management Committee |
Reserve / Activity Name |
Treatment Area Ha / Other |
Treatment Area (km2) |
| Baulkham Hills |
Porters Rd / Cranstons Rd |
|
5 |
| Baulkham Hills |
Porters Rd / Cranstons Rd (2) |
|
4 |
| Baulkham Hills |
Pauls Road Trail |
|
5 |
| Baulkham Hills |
Mount View Trail |
|
1 |
| Baulkham Hills |
Idlewild |
|
2 |
| Baulkham Hills |
Maroota Tracks Trail |
|
7 |
| Baulkham Hills |
Yoothamurra Trail |
|
1 |
| Baulkham Hills |
Kellys Arm Trail |
|
3 |
| Baulkham Hills |
Dargle Ridge Trail |
|
5 |
| Baulkham Hills |
Dargle Trail |
|
3 |
| Baulkham Hills |
Days Road Trail |
|
3 |
| Baulkham Hills |
Dickinsons Trail |
|
6 |
| Baulkham Hills |
Fingerboard Trail |
|
3 |
| Baulkham Hills |
Floyds Road Trail |
|
8 |
| Baulkham Hills |
Neichs Road Trail |
|
4 |
| Bega |
Eden Strategic Fire Trail |
|
3 |
| Bega |
Illawambera Fire Trail |
|
1 |
| Bega |
Merimbula/Turu Beach Strategic Protection |
|
2 |
| Bega |
Yankees Gap |
|
2 |
| Bega |
Millingandi Special Protection (Trail) |
|
1 |
| Bega |
Wallagoot Strategic Protection (Trail) |
|
1.2 |
| Bega |
South Eden Strategic Protection (Trail) |
|
1 |
| Bega |
Merimbula/Pambula Strategic Protection (APZ) |
|
1 |
| Bega |
Pacific St Tathra |
|
0.5 |
| Bland |
Bland Villages (FTM) |
|
2 |
| Bland |
Water Tower Reserve FTM |
|
3 |
| Blue Mountains |
Cripple Creek Fire Trail Stage 2 |
|
5 |
| Blue Mountains |
Cripple Creek Fire Trail Complex |
|
5 |
| Blue Mountains |
Caves Creek Trail |
|
0.4 |
| Blue Mountains |
Edith Falls Trail |
|
2 |
| Blue Mountains |
Boronia Rd – Albert Rd Trails |
|
1 |
| Blue Mountains |
Perimeter Trail – North Hazelbrook |
|
1.5 |
| Blue Mountains |
McMahons Point Trail – Kings Tableland |
|
7 |
| Blue Mountains |
Back Creek Fire Trail |
|
3.2 |
| Blue Mountains |
Mitchell’s Creek Fire Trail |
|
3.5 |
| Bombala |
Gibraltar Ridge Fire Trail |
|
11 |
| Bombala |
Burnt Hut Fire Trail |
|
5 |
| Bombala |
Merriangah East Fire Trail |
|
12 |
| Bombala |
Bombala Towns & Villages (Trails) |
|
10 |
| Campbelltown |
St Helens Park – Wedderburn Rd (Barriers) |
|
0.3 |
| Campbelltown |
Barrier / Gate |
|
|
| Campbelltown |
Riverview Rd Fire Trail |
|
0.65 |
| Canobolas |
Calula Range FTM |
|
|
| Canobolas |
Spring Glen Estate FTM |
|
|
| Cessnock |
Neath South West Fire Trail |
|
2 |
| Cessnock |
Neath South East Fire Trail |
|
1.5 |
| Cessnock |
Neath North Fire Trail (2) |
|
1 |
| Cessnock |
Gates – Asset Protection Zones |
|
|
| Cessnock |
Signs – Asset Protection Zones |
|
|
| Cessnock |
Signs – Fire Trails |
|
|
| Cessnock |
Kearsley Fire Trail |
|
0.5 |
| Cessnock |
Neath – South (Trail) |
|
4 |
| Cessnock |
Neath – North (Trail) |
|
2 |
| Clarence Valley |
Bowling Club Fire Trail |
|
1 |
| Clarence Valley |
Brooms Head Fire Trail |
|
0.2 |
| Clarence Valley |
Ilarwill Village |
|
0.3 |
| Cooma-Monaro |
Chakola Fire Trail |
|
21 |
| Cooma-Monaro |
Good Good Fire Trail |
|
12 |
| Cooma-Monaro |
Inaloy Fire Trail |
|
19 |
| Cooma-Monaro |
Cowra Creek Fire Trail |
|
4 |
| Cooma-Monaro |
David’s Fire Trail |
|
2.1 |
| Cooma-Monaro |
Clear Hills Fire Trail |
|
5 |
| Cooma-Monaro |
Mt Dowling Fire Trail |
|
16 |
| Cooma-Monaro |
Towneys Ridge Fire Trail |
|
6 |
| Cunningham |
Warialda Periphery 2 |
|
20 |
| Cunningham |
Upper Bingara Fire Trail |
|
|
| Dungog |
Dungog Fire Trail Signs |
|
|
| Far North Coast |
Byrangary Fire Trail |
|
1 |
| Far North Coast |
Main Arm Fire Trail (NC67) |
|
2 |
| Far North Coast |
Burringbar Fire Trail (NC69) |
|
1 |
| Far North Coast |
Mill Rd Fire Trail (NC95) |
|
1 |
| Far North Coast |
Broken Head Fire Trail (NC68) |
|
0.5 |
| Far North Coast |
New Brighton Fire Trail (NC44) |
|
0.5 |
| Far North Coast |
Mooball Spur Fire Trail |
|
1 |
| Far North Coast |
Palmwoods Fire Trail (NC06) |
|
0.5 |
| Gloucester |
Coneac Trail |
|
6 |
| Gloucester |
Moores Trail |
|
6 |
| Gloucester |
Mt Mooney Fire Trail |
|
6 |
| Gosford District |
Signs – Fire Trails |
|
|
| Great Lakes |
Ebsworth Fire Trail |
|
1 |
| Great Lakes |
Tuncurry High Fire Trail |
|
0.6 |
| Great Lakes |
Monterra Ave Trail – Hawks Nest |
|
0.7 |
| Greater Argyle |
Browns Rd Komungla |
|
12 |
| Greater Argyle |
Greater Argyle Fire Trail Maintenance |
|
|
| Greater Argyle |
Cookbundoon Fire Trail |
|
2 |
| Greater Taree District |
Tinonee St Road Reserve |
|
0.25 |
| Greater Taree District |
Beach St SFAZ – Wallabi Point |
|
0.35 |
| Greater Taree District |
Sth Woodlands Dr – SFAZ |
|
1.3 |
| Greater Taree District |
Cedar Party Rd – Taree |
|
2 |
| Hawkesbury District |
Sargents Road (2) ?tenure |
|
0.75 |
| Hawkesbury District |
Parallel Trail (2) |
|
2.5 |
| Hawkesbury District |
Parallel Trail (1) |
|
1.1 |
| Hornsby/Ku-ring-gai |
Tunks Ridge, Dural |
|
1 |
| Hornsby/Ku-ring-gai |
Radnor & Cairnes Fire Trail |
|
0.5 |
| Hornsby/Ku-ring-gai |
Binya Cl, Hornsby Heights |
|
1.5 |
| Shellharbour District |
Saddleback – Hoddles Trail |
|
3 |
| Shellharbour District |
Rough Range Trail |
|
1 |
| Lake Macquarie District |
Kilaben Bay Fire Trail |
|
1.5 |
| Lake Macquarie District |
Gates – Access Management |
|
|
| Lake Macquarie District |
Signs – APZ |
|
|
| Lake Macquarie District |
Signs – Fire Trails |
|
|
| Lithgow |
Wilsons Glen Trail |
|
6.1 |
| Lithgow |
Kanimbla Fire Trail No 314 |
|
7.8 |
| Lithgow |
Camels Back Trail No 312 |
|
4.5 |
| Lithgow |
Crown Creek Trail No 206 |
|
7 |
| Lithgow |
Capertee Common Trail No 203 |
|
3 |
| Lower Hunter Zone |
Access Infrastructure – All Districts |
|
|
| Lower North Coast |
Cabbage Tree Lane Fire Trail, Kempsey |
|
1.5 |
| Lower North Coast |
Bullocks Quarry Fire Trail |
|
0.66 |
| Lower North Coast |
Perimeter Protection, Main St, Eungai Creek, Nambucca |
|
0.6 |
| Mid North Coast |
Urunga Lagoon, Bellingen |
|
4 |
| Mid North Coast |
Wenonah Head, Bellingen |
|
4 |
| Mudgee |
Munro’s Fire Trail |
|
24 |
| Mudgee |
Munro’s Fire Trail |
|
5.25 |
| Penrith |
Londonderry/Castlereagh |
|
6 |
| Port Stephens |
Bobs Farm Fire Trails |
|
4 |
| Port Stephens |
Salamander Way Fire Trail |
|
1.5 |
| Port Stephens |
Gan Gan Hill West Fire Trail |
|
1.2 |
| Port Stephens |
Nelson Bay – Gan Gan Hill (Trail) |
|
1.5 |
| Port Stephens |
Taylors Beach Fire Trail |
|
1 |
| Port Stephens |
Nelson Bay – Wallawa Rd (SFAZ) |
|
0.7 |
| Port Stephens |
Taylors Beach East Fire Trail |
|
3.5 |
| Port Stephens |
Nelson Bay – Wallawa Rd (Gates) |
|
|
| Port Stephens |
Port Stephens Fire Trail Signs |
|
|
| Port Stephens |
Corlette – Salamander Way (Trail) |
|
1 |
| Shoalhaven |
APZ Access Works |
|
|
| Snowy River |
Southern Boundary Fire Trail |
|
3 |
| Snowy River |
Somme Valley Fire Trail |
|
5 |
| Sutherland District |
Forbes Creek North Trail |
|
1.3 |
| Sutherland District |
Still Creek Complex (Trail) |
|
3.8 |
| Sutherland District |
Mannikin Trail |
|
1.5 |
| Sutherland District |
Viburnum Trail |
|
0.8 |
| Sutherland District |
Mill Creek Complex |
|
2.6 |
| Sutherland District |
Loftus Creek Complex |
|
1.9 |
| Sutherland District |
Cranberry Trail |
|
0.8 |
| Sutherland District |
Turella Trail |
|
0.8 |
| Sutherland District |
Freemantle Trail |
|
0.4 |
| Sutherland District |
Illaroo Trail |
|
0.7 |
| Sutherland District |
Yala East Trail |
|
0.9 |
| Sutherland District |
Bunyan Fire Trail |
|
1.2 |
| Sutherland District |
Rosewell Service Trail |
|
0.5 |
| Sutherland District |
Belarada Service Trail |
|
0.3 |
| Sutherland District |
Belbowrie Service Trail |
|
0.3 |
| Sutherland District |
Leawarra Fire Trail |
|
0.9 |
| Sutherland District |
McKenzie Service Trail |
|
0.7 |
| Sutherland District |
Walsh Close Trail |
|
0.7 |
| Sutherland District |
Yala West Trail |
|
0.7 |
| Sutherland District |
Barnes Cres Service Trail |
|
0.6 |
| Sutherland District |
Illumba Trail |
|
0.5 |
| Sutherland District |
Penrose Trail |
|
0.5 |
| Sutherland District |
Tatler Place Trail |
|
0.5 |
| Sutherland District |
Torumba Service Trail |
|
0.5 |
| Sutherland District |
Friendship Trail |
|
0.4 |
| Sutherland District |
Kippax – Rosewall Trail |
|
0.4 |
| Sutherland District |
Tallarook Service Trail |
|
0.4 |
| Sutherland District |
Billa Service Trail |
|
0.3 |
| Sutherland District |
Chestnut Trail |
|
0.2 |
| Sutherland District |
Croston Rd Trail |
|
0.3 |
| Sutherland District |
Kingswood Rd Trail |
|
0.3 |
| Sutherland District |
Roebourne Trail |
|
0.3 |
| Sutherland District |
Whimbrel Service Trail |
|
0.3 |
| Sutherland District |
Shearwater Trail |
|
0.1 |
| Tamworth |
Moore Creek Dam Reserve |
|
3.5 |
| Tamworth |
Moore Creek Dam Reserve |
|
1 |
| Tumut |
Bundarbo Fire Trail (Stage 1) |
|
30 |
| Tumut |
Yammatree Reserve |
|
2 |
| Tumut |
Thomas Boyd Track Head |
|
2 |
| Tumut |
Tumut Bush Common |
|
5 |
| Tumut |
Batlow Hill |
|
2 |
| Tumut |
Rimmers Ridge – Adelong |
|
|
| Tumut |
Bangadang |
|
7 |
| Upper Lachlan |
Upper Lachlan Fire Trail Maintenance |
|
|
| Upper Lachlan |
Isabella Fire Trail |
|
10 |
| Wagga Wagga |
Silvatite Reserve (Trails) |
|
5 |
| Wagga Wagga |
Wagga Wagga Towns & Villages (Trails) |
|
10 |
| Wagga Wagga |
Kyeamba Gap |
|
4 |
| Wagga Wagga |
San Isadore |
|
3 |
| Warringah/Pittwater |
Sandy Trail |
|
0.1 |
| Warringah/Pittwater |
Lovett Bay Trail |
|
2.5 |
| Warringah/Pittwater |
Elvina Bay Trail |
|
1.5 |
| Warringah/Pittwater |
Aumuna Cooyong Trail |
|
0.2 |
| Wingecarribee |
P3 Fire Trail |
|
6 |
| Wingecarribee |
Weir Fire trail |
|
3.8 |
| Wingecarribee |
Lukes Fire trail |
|
0.1 |
| Wollondilly |
Bargo Weir Fire Trail |
|
10 |
| Wyong District |
YMCA North / South Link Fire Trail |
|
2 |
| Wyong District |
YMCA South / Kanangra Dr Fire Trail |
|
2 |
| Wyong District |
Lake Munmorah Fire Trails |
|
3.25 |
| Wyong District |
Hyles St Fire Trail, Chittaway Pt |
|
0.1 |
| Wyong District |
Big “T” and YMCA Link Fire Trails |
|
1.5 |
| Wyong District |
Lake Road Fire Trail, Chittaway Point |
|
0.1 |
| Wyong District |
Big “T” Fire Trail – Crangan Bay |
|
1.1 |
| Wyong District |
Wyong APZ Signs |
|
|
| Wyong District |
Lake Road Fire Trail, Tuggerah |
|
1 |
| Wyong District |
Doyalson North, 219-225 Pacific Hway (Trail) |
|
0.8 |
| Yass Valley |
Yass Valley Fire Trail Maintenance |
|
|
|
|
|
565.16 |
i.e. Approximately an area 24km x 24km
. .
Tags: Blue Mountains National Park, Bulldozing Six Foot Track, bush arson, Bush Fire Coordinating Committee, Bushfire Mitigation Programme, controlled burning, Department of Transport and Regional Services, DOTARS, Ecologically Sustainable Development, Fire Trail Strategy, Giant Burrowing Frog, Glossy Black-Cockatoo, hazard reduction, Megalong Creek, prescribed burning, RFS, Rural Fire Service, Six Foot Track, spotted-tailed quoll
Posted in Birds (Australian), Blue Mountains (AU), Quolls, Reptiles, Threats from Bushfire, Threats from Greenwashing | 1 Comment »
Add this post to Del.icio.us - Digg
Monday, February 27th, 2012
This article is by Scott Jordan, Campaign Coordinator Tarkine National Coalition, initially entitled ‘Shree Minerals’ Impact Statement documentation critically non-compliant‘ dated 20120222..
") Shree Minerals – foreign miners pillaging Tasmania’s precious Tarkine wilderness
(Photo courtesy of Tarkine National Coalition, click photo to enlarge) Shree Minerals – foreign miners pillaging Tasmania’s precious Tarkine wilderness
(Photo courtesy of Tarkine National Coalition, click photo to enlarge)
.
Tarkine National Coalition has described the Shree Minerals’ Environmental Impact Statement (EIS) for the proposed Nelson Bay River open cut iron ore mine as a mismatch of omissions, flawed assumptions and misrepresentations.
Key data on endangered orchids is missing,
and projections on impacts on Tasmanian Devil and Spotted-tailed Quoll
are based on flawed and fanciful data.
 Spotted-tailed Quoll Spotted-tailed Quoll
.
The EIS produced by the company as part of the Commonwealth environmental assessments has failed to produce a report relating to endangered and critically endangered orchid populations in the vicinity of the proposed open cut mine. The soil borne Mychorizza fungus is highly succeptible to changes in hydrology, and is essential to the germination of the area’s native orchids which cannot exist without Mychorizza. Federal Environment Minister Tony Burke included this report as a requirement in the project’s EIS guidelines issued in June 2011.
 Australia’s Minister for Environment
Tony Burke Australia’s Minister for Environment
Tony Burke
.
“Shree Minerals have decided that undertaking the necessary work on the proposal is likely to uncover some inconvenient truths, and so instead of producing scientific reports they are asking us to suspend common sense and accept that a 220 metre deep hole extending 1km long will have no impact on hydrology.” said Tarkine National Coalition spokesperson Scott Jordan.
") Utter devastation
A magnetite mine at nearby Savage River Utter devastation
A magnetite mine at nearby Savage River
.
“It’s a ridiculous notion when you consider that the mine depth will be some 170 metres below the level of the adjacent Nelson Bay River.”
TNC has also questioned the company’s motives in the clear contradictions and misrepresentations in the data relating to projections of Tasmanian devil roadkill from mine related traffic. The company has used a January-February traffic surveys as a current traffic baseline which skews the data due to the higher level of tourist, campers and shackowner during the traditional summer holiday season.
Department of Infrastructure, Energy and Resources (Tasmania) (DIER) data indicates that there is a doubling of vehicles on these road sections between October and January.
The company also asserted an assumed level of mine related traffic that is substantially lower than their own expert produced Traffic Impact Assessment.
The roadkill assumptions were made on an additional 82 vehicles per day in year one, and 34 vehicles per day in years 2-10, while the figures the Traffic Impact Assessment specify 122 vehicles per day in year one, and 89 vehicles per day in ongoing years.
“When you apply the expert Traffic Impact Assessment data and the DIER’s data for current road use, the increase in traffic is 329% in year one and 240% in years 2-10 which contradicts the company’s flawed projections of 89% and 34%”.
“This increase of traffic will, on the company’s formulae, result in up to 32 devil deaths per year, not the 3 per year in presented in the EIS.”
“Shree Minerals either is too incompetent to understand it’s own expert reports, or they have set out to deliberately mislead the Commonwealth and State environmental assessors.”
“Either way, they are unfit to be trusted with a Pilbara style iron ore mine in stronghold of threatened species like the Tarkine.”
The public comment period closed on Monday, and the company now has to compile public comments received and submit them with the EIS to the Commonwealth.
.
 . .
Discovery of Tasmanian devil facial tumour disease in the Tarkine
Media Release 20120224
.
Tarkine National Coalition has described the discovery of Tasmanian Devil Facial Tumour Disease (DFTD) at Mt Lindsay in the Tarkine as a tragedy.
")
“The Tarkine has been for a number of years the last bastion of disease free devils, and news that the disease has been found in the south eastern zone of the Tarkine is devastating news”, said Tarkine National Coalition spokesperson Scott Jordan.

“It is now urgent that the federal and state governments step up and take immediate action to prevent any factors that may exacerbate or accelerate the transmission of this disease to the remaining healthy populations in the Tarkine”.
“The decisions made today will have a critical impact on the survival of the Devil in the wild. Delay is no longer an option – today is the day for action.”

“They should start by reinstating the Emergency National Heritage Listing and placing an immediate halt on all mineral exploration activity in the Tarkine to allow EPBC assessments.”
.
NOTE: EPBC stands for Australia’s Environment Protection and Biodiversity Conservation Act 1999
.
.
 . .
") Proposed Mine Site Plan (Direct Shipping Ore) with flows to enter tributaries of Nelson River
(Source: Shree Minerals EIS, 2011) Proposed Mine Site Plan (Direct Shipping Ore) with flows to enter tributaries of Nelson River
(Source: Shree Minerals EIS, 2011)
.
“The Nelson Bay Iron Ore Project (ELs 41/2004 & 54/2008) covers the Nelson Bay Magnetite deposit with Inferred Mineral Resources reported to Australasian Joint Ore Reserves Committee (JORC) guidelines. Drilling will look to enlarge the deposit and improve the quality of the resource, currently standing at 6.8 Million tonnes @ 38.2% magnetite at a 20% magnetite cut off. In addition exploration work will look follow up recent drilling of near surface iron oxide mineralisation in an attempt delineate direct shipping ore. Exploration of additional magnetic targets will also be undertaken.”
[Source: Shree Minerals website, ^http://www.shreeminerals.com/shreemin/scripts/page.asp?mid=16&pageid=27]
.
The Irreversible Ecological Damage of Long Wall Mining
.
‘Impacts of Longwall Coal Mining on The Environment‘ >Read Report (700kb)
[Source: Total Environment Centre, NSW, 2007, ^http://www.tec.org.au/component/docman/doc_view/201-longwall-rep07]
.
Mining Experience in New South Wales – Waratah Rivulet
[Source: ^http://riverssos.org.au/mining-in-nsw/waratah-rivulet/]
.
The image belows show the shocking damage caused by longwall coal mining to the Waratah Rivulet, which flows into Woronora Dam.

Longwalls have run parallel to and directly under this once pristine waterway in the Woronora Catchment Special Area. You risk an $11,000 fine if you set foot in the Catchment without permission, yet coal companies can cause irreparable damage like this and get away with it.
Waratah Rivulet is a third order stream that is located just to the west of Helensburgh and feeds into the Woronora Dam from the south. Along with its tributaries, it makes up about 29% of the Dam catchment. The Dam provides both the Sutherland Shire and Helensburgh with drinking water. The Rivulet is within the Sydney Catchment Authority managed Woronora Special Area there is no public access without the permission of the SCA. Trespassers are liable to an $11,000 fine.
.
Longwall Mining under Waratah Rivulet
Metropolitan Colliery operates under the Woronora Special Area. Excel Coal operated it until October 2006 when Peabody Energy, the world’s largest coal mining corporation, purchased it. The method of coal extraction is longwall mining. Recent underground operations have taken place and still are taking place directly below the Waratah Rivulet and its catchment area.
In 2005 the NSW Scientific Committee declared longwall mining to be a key threatening process (read report below). The Waratah Rivulet was listed in the declaration along with several other rivers and creeks as being damaged by mining. No threat abatement plan was ever completed.
In September 2006, conservation groups were informed that serious damage to the Waratah Rivulet had taken place. Photographs were provided and an inspection was organised through the Sydney Catchment Authority (SCA) to take place on the 24th of November. On November 23rd, the Total Environment Centre met with Peabody Energy at the mining company’s request. They had heard of our forthcoming inspection and wanted to tell us about their operation and future mining plans. Through a PowerPoint presentation they told us we would be shocked by what we would see and that water had drained from the Rivulet but was reappearing further downstream closer to the dam.
The inspection took place on the 24th of November and was attended by officers from the SCA and the Department of Environment and Conservation (DEC), the Total Environment Centre, Colong Foundation, Rivers SOS and two independent experts on upland swamps and sandstone geology. We walked the length of the Rivulet that flows over the longwall panels. Although, similar waterways in the area are flowing healthily, the riverbed was completely dry for much of its length. It had suffered some of the worst cracking we had ever seen as a result of longwall mining. The SCA officers indicated that at one series of pools, water levels had dropped about 3m. We were also told there is anecdotal evidence suggesting the Rivulet has ceased to pass over places never previously known to have stopped flowing.
It appeared that the whole watercourse had tilted to the east as a result of the subsidence and upsidence. Rock ledges that were once flat now sloped. Iron oxide pollution stains were also present. The SCA also told us that they did not know whether water flows were returning further downstream. There was also evidence of failed attempts at remediation with a distinctly different coloured sand having washed out of cracks and now sitting on the dry river bed or in pools.
Also undermined was Flat Rock Swamp at the southernmost extremity of the longwall panels. It is believed to be the main source of water recharge for the Waratah Rivulet. It is highly likely that the swamp has also been damaged and is sitting on a tilt.
TEC has applied under Freedom of Information legislation to the SCA for documents that refer to the damage to the Waratah Rivulet.
During the meeting with Peabody on 23rd November, the company stated its intentions sometime in 2007 to submit a 3A application under the EP&A Act 1974 (NSW) to mine a further 27 longwall panels that will run under the Rivulet and finish under the Woronora Dam storage area.
This is very alarming given the damage that has already occurred to a catchment that provides the Sutherland Shire & Helensburgh with 29% of their drinking water. The dry bed of Waratah Rivulet above the mining area and the stain of iron oxide pollution may be seen clearly through Google Earth.
.
The Bigger Picture
In 2005 Rivers SOS, a coalition of 30 groups, formed with the aim of campaigning for the NSW Government to mandate a safety zone of at least 1km around rivers and creeks threatened by mining in NSW.
The peak environment groups of NSW endorse this position and it forms part of their election policy document.
.
Longwall Mining under or close to Rivers and Streams:
.
Seven major rivers and numerous creeks in NSW have been permanently damaged by mining operations which have been allowed to go too close to, or under, riverbeds. Some rivers are used as channels for saline and acid wastewater pumped out from mines. Many more are under threat. The Minister for Primary Industries, Ian Macdonald, is continuing to approve operations with the Department of Planning and DEC also involved in the process, as are a range of agencies (EPA, Fisheries, DIPNR, SCA, etc.) on an Interagency Review Committee. This group gives recommendations concerning underground mine plans to Ian Macdonald, but has no further say in his final decision. A document recently obtained under FOI by Rivers SOS shows that an independent consultant to the Interagency Committee recommended that mining come no closer than 350m to the Cataract River, yet the Minister approved mining to come within 60m.
The damage involves multiple cracking of river bedrock, ranging from hairline cracks to cracks up to several centimetres wide, causing water loss and pollution as ecotoxic chemicals are leached from the fractured rocks.
.
Aquifers may often be breached.
.
Satisfactory remediation is not possible. In addition, rockfalls along mined river gorges are frequent. The high price of coal and the royalties gained from expanding mines are making it all too tempting for the Government to compromise the integrity of our water catchments and sacrifice natural heritage.
.
Longwall Mining in the Catchments
.
Longwall coal mining is taking place across the catchment areas south of Sydney and is also proposed in the Wyong catchment. Of particular concern is BHP-B’s huge Dendrobium mine which is undermining the Avon and Cordeaux catchments, part of Sydney’s water supply.
A story in the Sydney Morning Herald in January 2005 stated that the SCA were developing a policy for longwall coal mining within the catchments that would be ready by the middle of that year. This policy is yet to materialise.
The SMP approvals process invariably promises remediation and further monitoring. But damage to rivers continues and applications to mine areapproved with little or no significant conditions placed upon the licence.
Remediation involves grouting some cracks but cannot cover all of the cracks, many of which go undetected, in areas where the riverbed is sandy for example.
Sometimes the grout simply washes out of the crack, as is the case in the Waratah Rivulet.
The SCA was established as a result of the 1998 Sydney water crisis. Justice Peter McClellan, who led the subsequent inquiry, determined that a separate catchment management authority with teeth should be created because, as he said “someone should wake up in the morning owning the issue” of adequate management.
An audit of the SCA and the catchments in 1999 found multiple problems including understaffing, the need to interact with so many State agencies, and enormous pressure from developers. Developers in the catchments include mining companies. In spite of government policies such as SEPP 58, stating that development in catchments should have only a “neutral or beneficial effect” on water quality, longwall coal mining in the catchments have been, and are being, approved by the NSW government.
Overidden by the Mining Act 1992, the SCA appears powerless to halt the damage to Sydney’s water supply.
.
Alteration of habitat following subsidence due to longwall mining – key threatening process listing
[Source: ‘Alteration of habitat following subsidence due to longwall mining – key threatening process listing’, Dr Lesley Hughes, ChairpersonScientific Committee, Proposed Gazettal date: 15/07/05, Exhibition period: 15/07/05 – 09/09/05on Department of Environment (NSW) website,^http://www.environment.nsw.gov.au/determinations/LongwallMiningKtp.htm]
.
NSW Scientific Committee – final determination
.
The Scientific Committee, established by the Threatened Species Conservation Act, has made a Final Determination to list Alteration of habitat following subsidence due to longwall mining as a KEY THREATENING PROCESS in Schedule 3 of the Act. Listing of key threatening processes is provided for by Part 2 of the Act.
.
The Scientific Committee has found that:
1. Longwall mining occurs in the Northern, Southern and Western Coalfields of NSW. The Northern Coalfields are centred on the Newcastle-Hunter region. The Southern Coalfield lies principally beneath the Woronora, Nepean and Georges River catchments approximately 80-120 km SSW of Sydney. Coalmines in the Western Coalfield occur along the western margin of the Sydney Basin. Virtually all coal mining in the Southern and Western Coalfields is underground mining.
2. Longwall mining involves removing a panel of coal by working a face of up to 300 m in width and up to two km long. Longwall panels are laid side by side with coal pillars, referred to as “chain pillars” separating the adjacent panels. Chain pillars generally vary in width from 20-50 m wide (Holla and Barclay 2000). The roof of the working face is temporarily held up by supports that are repositioned as the mine face advances (Karaman et al. 2001). The roof immediately above the coal seam then collapses into the void (also known as the goaf) and a collapse zone is formed above the extracted area. This zone is highly fractured and permeable and normally extends above the seam to a height of five times the extracted seam thickness (typical extracted seam thickness is approximately 2-3.5 m) (ACARP 2002). Above the collapse zone is a fractured zone where the permeability is increased to a lesser extent than in the collapse zone. The fractured zone extends to a height above the seam of approximately 20 times the seam thickness, though in weaker strata this can be as high as 30 times the seam thickness (ACARP 2002). Above this level, the surface strata will crack as a result of bending strains, with the cracks varying in size according to the level of strain, thickness of the overlying rock stratum and frequency of natural joints or planes of weakness in the strata (Holla and Barclay 2000).
3. The principal surface impact of underground coal mining is subsidence (lowering of the surface above areas that are mined) (Booth et al. 1998, Holla and Barclay 2000). The total subsidence of a surface point consists of two components, active and residual. Active subsidence, which forms 90 to 95% of the total subsidence in most cases, follows the advance of the working face and usually occurs immediately. Residual subsidence is time-dependent and is due to readjustment and compaction within the goaf (Holla and Barclay 2000). Trough-shaped subsidence profiles associated with longwall mining develop tilt between adjacent points that have subsided different amounts.
Maximum ground tilts are developed above the edges of the area of extraction and may be cumulative if more than one seam is worked up to a common boundary. The surface area affected by ground movement is greater than the area worked in the seam (Bell et al. 2000). In the NSW Southern Coalfield, horizontal displacements can extend for more than one kilometre from mine workings (and in extreme cases in excess of three km) (ACARP 2002, 2003), although at these distances, the horizontal movements have little associated tilt or strain. Subsidence at a surface point is due not only to mining in the panel directly below the point, but also to mining in the adjacent panels. It is not uncommon for mining in each panel to take a year or so and therefore a point on the surface may continue to experience residual subsidence for several years (Holla and Barclay 2000).
4. The degree of subsidence resulting from a particular mining activity depends on a number of site specific factors. Factors that affect subsidence include the design of the mine, the thickness of the coal seam being extracted, the width of the chain pillars, the ratio of the depth of overburden to the longwall panel width and the nature of the overlying strata; sandstones are known to subside less than other substrates such as shales. Subsidence is also dependent on topography, being more evident in hilly terrain than in flat or gently undulating areas (Elsworth and Liu 1995, Holla 1997, Holla and Barclay 2000, ACARP 2001). The extent and width of surface cracking over and within the vicinity of the mined goaf will also decrease with an increased depth of mining (Elsworth and Liu 1995).
5. Longwall mining can accelerate the natural process of ‘valley bulging’ (ACARP 2001, 2002). This phenomenon is indicated by an irregular upward spike in an otherwise smooth subsidence profile, generally co-inciding with the base of the valley. The spike represents a reduced amount of subsidence, known as ‘upsidence’, in the base and sides of the valley and is generally coupled with the horizontal closure of the valley sides (ACARP 2001, 2002). In most cases, the upsidence effects extend outside the valley and include the immediate cliff lines and ground beyond them (ACARP 2002).
6. Mining subsidence is frequently associated with cracking of valley floors and creeklines and with subsequent effects on surface and groundwater hydrology (Booth et al. 1998, Holla and Barclay 2000, ACARP 2001, 2002, 2003). Subsidence-induced cracks occurring beneath a stream or other surface water body may result in the loss of water to near-surface groundwater flows.
If the water body is located in an area where the coal seam is less than approximately 100-120 m below the surface, longwall mining can cause the water body to lose flow permanently. If the coal seam is deeper than approximately 150 m, the water loss may be temporary unless the area is affected by severe geological disturbances such as strong faulting. In the majority of cases, surface waters lost to the sub-surface re-emerge downstream. The ability of the water body to recover is dependent on the width of the crack, the surface gradient, the substrate composition and the presence of organic matter. An already-reduced flow rate due to drought conditions or an upstream dam or weir will increase the impact of water loss through cracking. The potential for closure of surface cracks is improved at sites with a low surface gradient although even temporary cracking, leading to loss of flow, may have long-term effects on ecological function in localised areas. The steeper the gradient, the more likely that any solids transported by water flow will be moved downstream allowing the void to remain open and the potential loss of flows to the subsurface to continue.
A lack of thick alluvium in the streambed may also prolong stream dewatering (by at least 13 years, in one case study in West Virginia, Gill 2000).
Impacts on the flows of ephemeral creeks are likely to be greater than those on permanent creeks (Holla and Barclay 2000). Cracking and subsequent water loss can result in permanent changes to riparian community structure and composition.
7. Subsidence can also cause decreased stability of slopes and escarpments, contamination of groundwater by acid drainage, increased sedimentation, bank instability and loss, creation or alteration of riffle and pool sequences, changes to flood behaviour, increased rates of erosion with associated turbidity impacts, and deterioration of water quality due to a reduction in dissolved oxygen and to increased salinity, iron oxides, manganese, and electrical conductivity (Booth et al. 1998, Booth and Bertsch 1999, Sidle et al. 2000, DLWC 2001, Gill 2000, Stout 2003). Displacement of flows may occur where water from mine workings is discharged at a point or seepage zone remote from the stream, and in some cases, into a completely different catchment. Where subsidence cracks allow surface water to mix with subsurface water, the resulting mixture may have altered chemical properties. The occurrence of iron precipitate and iron-oxidising bacteria is particularly evident in rivers where surface cracking has occurred. These bacteria commonly occur in Hawkesbury Sandstone areas, where seepage through the rock is often rich in iron compounds (Jones and Clark 1991) and are able to grow in water lacking dissolved oxygen. Where the bacteria grow as thick mats they reduce interstitial habitat, clog streams and reduce available food (DIPNR 2003). Loss of native plants and animals may occur directly via iron toxicity, or indirectly via smothering. Long-term studies in the United States indicate that reductions in diversity and abundance of aquatic invertebrates occur in streams in the vicinity of longwall mining and these effects may still be evident 12 years after mining (Stout 2003, 2004).
8. The extraction of coal and the subsequent cracking of strata surrounding the goaf may liberate methane, carbon dioxide and other gases. Most of the gas is removed by the ventilation system of the mine but some gas remains within the goaf areas. Gases tend to diffuse upwards through any cracks occurring in the strata and be emitted from the surface (ACARP 2001). Gas emissions can result in localised plant death as anaerobic conditions are created within the soil (Everett et al. 1998).
9. Subsidence due to longwall mining can destabilise cliff-lines and increase the probability of localised rockfalls and cliff collapse (Holla and Barclay 2000, ACARP 2001, 2002). This has occurred in the Western Coalfield and in some areas of the Southern Coalfield (ACARP 2001). These rockfalls have generally occurred within months of the cliffline being undermined but in some cases up to 18 years after surface cracking first became visible following mining (ACARP 2001). Changes to cliff-line topography may result in an alteration to the environment of overhangs and blowouts. These changes may result in the loss of roosts for bats and nest sites for cliff-nesting birds.
10. Damage to some creek systems in the Hunter Valley has been associated with subsidence due to longwall mining. Affected creeks include Eui Creek, Wambo Creek, Bowmans Creek, Fishery Creek and Black Creek (Dept of Sustainable Natural Resources 2003, in lit.). Damage has occurred as a result of loss of stability, with consequent release of sediment into the downstream environment, loss of stream flow, death of fringing vegetation, and release of iron rich and occasionally highly acidic leachate. In the Southern Coalfields substantial surface cracking has occurred in watercourses within the Upper Nepean, Avon, Cordeaux, Cataract, Bargo, Georges and Woronora catchments, including Flying Fox Creek, Wongawilli Creek, Native Dog Creek and Waratah Rivulet. The usual sequence of events has been subsidence-induced cracking within the streambed, followed by significant dewatering of permanent pools and in some cases complete absence of surface flow.
11. The most widely publicised subsidence event in the Southern Coalfields was the cracking of the Cataract riverbed downstream of the Broughtons Pass Weir to the confluence of the Nepean River. Mining in the vicinity began in 1988 with five longwall panels having faces of 110 m that were widened in 1992 to 155 m. In 1994, the river downstream of the longwall mining operations dried up (ACARP 2001, 2002). Water that re-emerged downstream was notably deoxygenated and heavily contaminated with iron deposits; no aquatic life was found in these areas (Everett et al. 1998). In 1998, a Mining Wardens Court Hearing concluded that 80% of the drying of the Cataract River was due to longwall mining operations, with the balance attributed to reduced flows regulated by Sydney Water. Reduction of the surface river flow was accompanied by release of gas, fish kills, iron bacteria mats, and deterioration of water quality and instream habitat. Periodic drying of the river has continued, with cessation of flow recorded on over 20 occasions between June 1999 and October 2002 (DIPNR 2003). At one site, the ‘Bubble Pool”, localised water loss up to 4 ML/day has been recorded (DIPNR 2003).
Piezometers indicated that there was an unusually high permeability in the sandstone, indicating widespread bedrock fracturing (DIPNR 2003). High gas emissions within and around areas of dead vegetation on the banks of the river have been observed and it is likely that this dieback is related to the generation of anoxic conditions in the soil as the migrating gas is oxidised (Everett et al. 1998). An attempt to rectify the cracking by grouting of the most severe crack in 1999 was only partially successful (AWT 2000). In 2001, water in the Cataract River was still highly coloured, flammable gas was still being released and flow losses of about 50% (3-3.5 ML/day) still occurring (DLWC 2001). Environmental flow releases of 1.75 ML/day in the Cataract River released from Broughtons Pass Weir were not considered enough to keep the river flowing or to maintain acceptable water quality (DIPNR 2003).
12. Subsidence associated with longwall mining has contributed to adverse effects (see below) on upland swamps. These effects have been examined in most detail on the Woronora Plateau (e.g. Young 1982, Gibbins 2003, Sydney Catchment Authority, in lit.), although functionally similar swamps exist in the Blue Mountains and on Newnes Plateau and are likely to be affected by the same processes. These swamps occur in the headwaters of the Woronora River and O’Hares Creek, both major tributaries of the Georges River, as well as major tributaries of the Nepean River, including the Cataract and Cordeaux Rivers. The swamps are exceptionally species rich with up to 70 plant species in 15 m2 (Keith and Myerscough 1993) and are habitats of particular conservation significance for their biota. The swamps occur on sandstone in valleys with slopes usually less than ten degrees in areas of shallow, impervious substrate formed by either the bedrock or clay horizons (Young and Young 1988). The low gradient, low discharge streams cannot effectively flush sediment so they lack continuous open channels and water is held in a perched water table. The swamps act as water filters, releasing water slowly to downstream creek systems thus acting to regulate water quality and flows from the upper catchment areas (Young and Young 1988).
13. Upland swamps on the Woronora Plateau are characterised by ti-tree thicket, cyperoid heath, sedgeland, restioid heath and Banksia thicket with the primary floristic variation being related to soil moisture and fertility (Young 1986, Keith and Myerscough 1993). Related swamp systems occur in the upper Blue Mountains including the Blue Mountains Sedge Swamps (also known as hanging swamps) which occur on steep valley sides below an outcropping claystone substratum and the Newnes Plateau Shrub Swamps and Coxs River Swamps which are also hydrologically dependent on the continuance of specific topographic and geological conditions (Keith and Benson 1988, Benson and Keith 1990). The swamps are subject to recurring drying and wetting, fires, erosion and partial flushing of the sediments (Young 1982, Keith 1991). The conversion of perched water table flows into subsurface flows through voids, as a result of mining-induced subsidence may significantly affect the water balance of upland swamps (eg Young and Wray 2000). The scale of this impact is currently unknown, however, changes in vegetation may not occur immediately. Over time, areas of altered hydrological regime may experience a modification to the vegetation community present, with species being favoured that prefer the new conditions. The timeframe of these changes is likely to be long-term. While subsidence may be detected and monitored within months of a mining operation, displacement of susceptible species by those suited to altered conditions is likely to extend over years to decades as the vegetation equilibrates to the new hydrological regime (Keith 1991, NPWS 2001). These impacts will be exacerbated in periods of low flow. Mine subsidence may be followed by severe and rapid erosion where warping of the swamp surface results in altered flows and surface cracking creates nick-points (Young 1982). Fire regimes may also be altered, as dried peaty soils become oxidised and potentially flammable (Sydney Catchment Authority, in lit.) (Kodela et al. 2001).
14. The upland swamps of the Woronora Plateau and the hanging swamps of the Blue Mountains provide habitat for a range of fauna including birds, reptiles and frogs. Reliance of fauna on the swamps increases during low rainfall periods. A range of threatened fauna including the Blue Mountains Water Skink, Eulamprus leuraensis, the Giant Dragonfly, Petalura gigantea, the Giant Burrowing Frog, Heleioporus australiacus, the Red-crowned Toadlet, Pseudophryne australis, the Stuttering Frog Mixophyes balbus and Littlejohn’s Tree Frog, Litoria littlejohni, are known to use the swamps as habitat. Of these species, the frogs are likely to suffer the greatest impacts as a result of hydrological change in the swamps because of their reliance on the water within these areas either as foraging or breeding habitat. Plant species such as Persoonia acerosa, Pultenaea glabra, P. aristata and Acacia baueri ssp. aspera are often recorded in close proximity to the swamps.
Cliffline species such as Epacris hamiltonii and Apatophyllum constablei that rely on surface or subsurface water may also be affected by hydrological impacts on upland swamps, as well as accelerated cliff collapse associated with longwall mining.
15. Flora and fauna may also be affected by activities associated with longwall mining in addition to the direct impacts of subsidence. These activities include clearing of native vegetation and removal of bush rock for surface facilities such as roads and coal wash emplacement and discharge of mine water into swamps and streams. Weed invasion, erosion and siltation may occur following vegetation clearing or enrichment by mine water. Clearing of native vegetation, Bushrock removal, Invasion of native plant communities by exotic perennial grasses and Alteration to the natural flow regimes of rivers and streams and their floodplains and wetlands are listed as Key Threatening Processes under the Threatened Species Conservation Act (1995).
.
The following threatened species and ecological communities are known to occur in areas affected by subsidence due to longwall mining and their habitats are likely to be altered by subsidence and mining-associated activities:
Endangered Species
- Epacris hamiltonii a shrub
- Eulamprus leuraensis Blue Mountains Water Skink
- Hoplocephalus bungaroides Broad-headed Snake
- Isoodon obesulus Southern Brown Bandicoot
- Petalura gigantea Giant Dragonfly
.
Vulnerable species
- Acacia baueri subsp. aspera
- Apatophyllum constablei
- Boronia deanei
- Cercartetus nanus Eastern Pygmy Possum
- Epacris purpurascens var. purpurascens
- Grevillea longifolia
- Heleioporus australiacus Giant Burrowing Frog
- Ixobrychus flavicollis Black Bittern
- Leucopogon exolasius
- Litoria littlejohni Littlejohn’s Tree Frog
- Melaleuca deanei
- Mixophyes balbus Stuttering Frog
- Myotis adversus Large-footed Myotis
- Persoonia acerosa
- Potorous tridactylus Long-nosed Potoroo
- Pseudophryne australis Red-crowned Toadlet
- Pteropus poliocephalus Grey-headed Flying Fox
- Pterostylis pulchella
- Pultenaea aristata
- Pultenaea glabra
- Tetratheca juncea
- Varanus rosenbergi Rosenberg’s Goanna
.
Endangered Ecological Communities
.
- Genowlan Point Allocasuarina nana Heathland
- Newnes Plateau Shrub Swamp in the Sydney Basin Bioregion
- O’Hares Creek Shale Forest
- Shale/Sandstone Transition Forest
.
Species and populations of species not currently listed as threatened but that may become so as a result of habitat alteration following subsidence due to longwall mining include:
- Acacia ptychoclada
- Almaleea incurvata
- Darwinia grandiflora
- Dillwynia stipulifera
- Epacris coricea
- Grevillea acanthifolia subsp. acanthifolia
- Hydromys chrysogaster Water rat
- Lomandra fluviatilis
- Olearia quercifolia
- Pseudanthus pimelioides
.
16. Mitigation measures to repair cracking creek beds have had only limited success and are still considered experimental (ACARP 2002). Cracks less than 10 mm wide may eventually reseal without active intervention provided there is a clay fraction in the soil and at least some water flow is maintained.
Cracks 10-50 mm wide may be sealed with a grouting compound or bentonite.
Cracks wider than 50 mm require concrete (ACARP 2002). Pattern grouting in the vicinity of Marhnyes Hole in the Georges River has been successful at restoring surface flows and reducing pool drainage following fracturing of the riverbed (International Environmental Consultants 2004). Grouting of cracks also appears to have been relatively effective in Wambo Creek in the Hunter Valley. Installation of a grout curtain in the Cataract River, however, has been only partially successful and it was concluded in 2002, after rehabilitation measures had taken place, that the environment flows released from Broughtons Pass Weir by the Sydney Catchment Authority were insufficient to keep the Cataract River flowing or to maintain acceptable water quality (DIPNR 2003). Mitigation measures themselves may have additional environmental impacts due to disturbance from access tracks, the siting of drilling rigs, removal of riparian vegetation, and unintended release of the grouting material into the water. Furthermore, even measures that are successful in terms of restoring flows involve temporary rerouting of surface flows while mitigation is carried out (generally for 2-3 weeks at each grouting site). Planning for remediation measures may also be hampered by the lack of predictability of some impacts, and difficulties gaining access to remote areas where remedial works are needed. The long-term success of mitigation measures such as grouting is not yet known. It is possible that any ongoing subsidence after grouting may reopen cracks or create new ones.
Further, it is not yet known whether the clay substance bentonite, which is often added to the cement in the grouting mix, is sufficiently stable to prevent shrinkage. Grouting under upland and hanging swamps that have no definite channel is probably not feasible.
17. Empirical methods have been developed from large data sets to predict conventional subsidence effects (ACARP 2001, 2002, 2003). In general, these models have proved more accurate when predicting the potential degree of subsidence in flat or gently undulating terrain than in steep topography (ACARP 2003). A major issue identified in the ACARP (2001, 2002) reports was the lack of knowledge about horizontal stresses in geological strata, particularly those associated with river valleys. These horizontal stresses appear to play a major role in the magnitude and extent of surface subsidence impacts. The cumulative impacts of multiple panels also appear to have been poorly monitored. The general trend in the mining industry in recent years toward increased panel widths (from 200 up to 300 m), which allows greater economies in the overall costs of extraction, means that future impacts will tend to be greater than those in the past (ACARP 2001, 2002).
18. In view of the above the Scientific Committee is of the opinion that Alteration of habitat following subsidence due to longwall mining adversely affects two or more threatened species, populations or ecological communities, or could cause species, populations or ecological communities that are not threatened to become threatened.
.
References
.
ACARP (2001) ‘Impacts of Mine Subsidence on the Strata & Hydrology of River Valleys – Management Guidelines for Undermining Cliffs, Gorges and River Systems’. Australian Coal Association Research Program Final Report C8005 Stage 1, March 2001.
ACARP (2002) ‘Impacts of Mine Subsidence on the Strata & Hydrology of River Valleys – Management Guidelines for Undermining Cliffs, Gorges and River Systems’. Australian Coal Association Research Program Final Report C9067 Stage 2, June 2002.
ACARP (2003) ‘Review of Industry Subsidence Data in Relation to the Influence of Overburden Lithology on Subsidence and an Initial Assessment of a Sub-Surface Fracturing Model for Groundwater Analysis’. Australian Coal Association Research Program Final Report C10023, September 2003.
AWT (2000) ‘Investigation of the impact of bed cracking on water quality in the Cataract River.’ Prepared for the Dept. of Land and Water Conservation Sydney South Coast Region. AWT Report no. 2000/0366.
Bell FG, Stacey TR, Genske DD (2000) Mining subsidence and its effect on the environment: some differing examples. Environmental Geology 40, 135-152.
Benson DH, Keith DA (1990) The natural vegetation of the Wallerawang 1:100,000 map sheet. Cunninghamia 2, 305-335.
Booth CJ, Bertsch LP (1999) Groundwater geochemistry in shallow aquifers above longwall mines in Illinois, USA. Hydrogeology Journal 7, 561-575.
Booth CJ, Spande ED, Pattee CT, Miller JD, Bertsch LP (1998) Positive and negative impacts of longwall mine subsidence on a sandstone aquifer.
Environmental Geology 34, 223-233.
DIPNR (2003) ‘Hydrological and water quality assessment of the Cataract River; June 1999 to October 2002: Implications for the management of longwall coal mining.’ NSW Department of Infrastructure, Planning and Environment, Wollongong.
DLWC (2001) ‘Submission to the Commission of Inquiry into the Proposed Dendrobium Underground Coal Mine Project by BHP Steel (AIS) Pty Ltd, Wollongong, Wingecarribee & Wollondilly Local Government Areas’. Department of Land and Water Conservation, July 2001.
Elsworth D, Liu J (1995) Topographic influence of longwall mining on ground-water supplies. Ground Water 33, 786-793.
Everett M, Ross T, Hunt G (eds) (1998) ‘Final Report of the Cataract River Taskforce. A report to the Upper Nepean Catchment Management Committee of the studies of water loss in the lower Cataract River during the period 1993 to 1997.’ Cataract River Taskforce, Picton.
Gibbins L (2003) A geophysical investigation of two upland swamps, Woronora Plateau, NSW, Australia. Honours Thesis, Macquarie University.
Gill DR (2000) Hydrogeologic analysis of streamflow in relation to undergraound mining in northern West Virginia. MSc thesis, West Virginia University, Morgantown, West Virginia.
Holla L (1997) Ground movement due to longwall mining in high relief areas in New South Wales, Australia. International Journal of Rock Mechanics and Mining Sciences 34, 775-787.
Holla L, Barclay E (2000) ‘Mine subsidence in the Southern Coalfield, NSW, Australia’. Mineral Resources of NSW, Sydney.
International Environmental Consultants Pty Ltd (2004) ‘Pattern grouting remediation activities: Review of Environmental Effects Georges River Pools 5-22. May, 2004’.
Jones DC, Clark NR (eds) (1991) Geology of the Penrith 1:100,000 Sheet 9030, NSW. Geological Survey, NSW Department of Minerals and Energy.
Karaman A, Carpenter PJ, Booth CJ (2001) Type-curve analysis of water-level changes induced by a longwall mine. Environmental Geology 40, 897-901.
Keith DA (1991) Coexistence and species diversity in upland swamp vegetation. PhD thesis. University of Sydney.
Keith DA (1994) Floristics, structure and diversity of natural vegetation in the O’Hares Creek catchment, south of Sydney. Cunninghamia 3, 543-594.
Keith DA, Benson DH (1988) The natural vegetation of the Katoomba 1:100,000 map sheet. Cunninghamia 2, 107-143.
Kodela PG, Sainty GR, Bravo FJ, James TA (2001) ‘Wingecarribee Swamp flora survey and related management issues.’ Sydney Catchment Authority, New South Wales.
Keith DA, Myerscough PJ (1983) Floristics and soil relations of upland swamp vegetation near Sydney. Australian Journal of Ecology 18, 325-344.
NPWS (2001) ‘NPWS Primary Submission to the Commission of Inquiry into the Dendrobium Coal Project’. National Parks and Wildlife Service, July 2001.
Sidle RC, Kamil I, Sharma A, Yamashita S (2000) Stream response to subsidence from underground coal mining in central Utah. Environmental Geology 39, 279-291.
Stout BM III (2003) ‘Impact of longwall mining on headwater streams in northern West Virginia’. Final Report, June 2003 for the West Virginia Water Research Institute.
Stout BM III (2004) ‘Do headwater streams recover from longwall mining impacts in northern West Virginia’. Final Report, August 2004 for the West Virginia Water Research Institute.
Young ARM (1982) Upland swamps (dells) on the Woronora Plateau, N.S.W. PhD thesis, University of Wollongong.
Young ARM (1986) The geomorphic development of upland dells (upland swamps) on the Woronora Plateau, NSW, Australia. Zeitschrift für Geomorphologie N.F. Bd 30, Heft 3,312-327.
Young RW, Wray RAL (2000) The geomorphology of sandstones in the Sydney Region. In McNally GH and Franklin BJ eds Sandstone City – Sydney’s Dimension Stone and other Sandstone Geomaterials. Proceedings of a symposium held on 7th July 2000, 15th Australian Geological Convention, University of
Technology Sydney. Monograph No. 5, Geological Society of Australia, Springwood, NSW. Pp 55-73.
Young RW, Young ARM (1988) ‘Altogether barren, peculiarly romantic’: the sandstone lands around Sydney. Australian Geographer 19, 9-25.
.
Tags: Emergency National Heritage Listing, Nelson Bay Iron Ore Project, Nelson Bay Magnetite, Nelson Bay River, Shree Minerals, spotted-tailed quoll, tarkine, Tasmanian Devil, Tasmanian Devil Facial Tumour Disease, Tony Burke
Posted in Tasmania (AU), Tasmanian Devils, Threats from Mining, Threats to Wild Tasmania | No Comments »
Add this post to Del.icio.us - Digg
Saturday, January 7th, 2012
 Cathcart State Forest (NSW) being logged in 2011
[Source: Australian Forests and Climate Alliance ^http://forestsandclimate.net/newsouthwales] Cathcart State Forest (NSW) being logged in 2011
[Source: Australian Forests and Climate Alliance ^http://forestsandclimate.net/newsouthwales]
.
Most of Australia’s native vegetation cover, over 75% of that predating the 1788 Colonial Invasion, has been ‘cleared’ – a euphemism for deforested, logged, destroyed, killed.
Today, as one travels around Australia and sees vasts areas of unproductive, degraded, denuded and abandoned farmlands – one questions why destroy more fragile environment? Yet the exploitative bastards are still hell bent on killing more native forest and bushland, even though they can’t properly manage the ‘already ‘cleared’ lands they’ve got. It is a short sighted insatiability, harking to a 19th Century ‘old blighty’ mindset of taming the land. It is deluded thinking that just because the native vegetation is green and looks fertile that it can be replaced for pasture and cropping and that new cleared land will be any different to that already cleared.
The Liberal-Labor governments and their rural National mates haven’t given a toss throughout the entire 20th Century and still couldn’t give a toss.
 Recent land clearing in the Daly River catchment area
Northern Territory, Australia.
Photo: Environment Centre NT Recent land clearing in the Daly River catchment area
Northern Territory, Australia.
Photo: Environment Centre NT
.
") Moree region New South Wales – mainly deforested
Visit Google Earth and zoom into any area of NSW and see that most of it has been deforested
(click image to enlarge) Moree region New South Wales – mainly deforested
Visit Google Earth and zoom into any area of NSW and see that most of it has been deforested
(click image to enlarge)
.
Still across Australia in 2011, thousands of hectares of native forests continue to be deforested – albeit for farming, logging and development, or just bizarre bushfire abandonment. Not only is this occurring on private land, but in State Forests, which most people think are protected. Native forests on land are being cleared branded by State governments as ‘State Forests’ are simply not protected.
The native trees, flora and fauna are not protected from logging, bushfire, State-sanctioned arson (aka ‘hazard reduction‘), State napalming (aka indiscriminate ‘hazard reduction‘), indiscriminate State aerial poisoning with 1080, wildlife poaching, 4WD hooning, trail bike hooning, or even backpacker murdering. The watercourses (and the interconnected groundwater aquifers), that flow through State Forests are not protected from fishing, stormwater run-off, mine tailing contamination, farm pesticide and herbicide, industrial pollution.
.
 Helicopter Aerial Incendiary
Over Bindarri National Park, 20km south-west of Coffs Harbour, New South Wales
Yes, even our National Parks and Wildlife Service sets indiscriminate fires to National Parks! Helicopter Aerial Incendiary
Over Bindarri National Park, 20km south-west of Coffs Harbour, New South Wales
Yes, even our National Parks and Wildlife Service sets indiscriminate fires to National Parks!
.
For the likes of taxpayer funded government industrial loggers ‘State Forest’ is a euphemism ‘for not logged yet‘. This applies to the likes of Forestry Tasmania, VicForests, Forests NSW, Forestry SA (spot the naming trend), as well as the more aptly Queensland Department of Primary Industries and Fisheries, and likewise the Forest Products Commission of Western Australia.
It seems that doesn’t matter whether there is proof that there is an endangered and protected species such as the Long-Footed Potoroo in the Cann Valley State Forest or Drummer State Forest in Victoria, or protected Koalas in the Murrah/Mumbulla State Forests of New South Wales, or three identified endangered species, the wedge-tailed eagle, the swift parrot and the wielangta stag beetle in Tasmania’s Wielangta State Forests, the Liberal-Labor governments of those States turn a blind eye to deforestation.
It is only when self-funded local communities take the respective government logger to the Supreme Court and win that logging stops momentarily, such as in the recent Victorian Supreme Court case Environment East Gippsland Inc v VicForests [2010] VSC 335. In 2006, the Victorian State Government committed to increasing the conservation parks and reserves within the broader Brown Mountain area. Disregarding its elected master and ignoring any concerns for the ecological Precautionary Principle, State industrial logger VicForests, got stuck in with its mechanical clearfelling of old growth forests in the Brown Mountain area.
Not-for profit group Environment East Gippsland (EEG) self-funded and obtained numerous studies of the area indicated the presence of important threatened and rare species. EEG requested the Minister for Environment and Climate Change, Gavin Jennings, to make an interim conservation order to conserve critical habitat of the endangered Long-footed Potoroo, Spotted-tailed Quoll, Sooty Owl, Powerful Owl and Orbost Spiny Crayfish at Brown Mountain. Even then, the Minister for Environment and Climate Chang did not grant a conservation order, but instead increased the conservation area surrounding Brown Mountain. It took the overriding legal authority of the Supreme Court to stop the Victorian Government and its delinquent logger trashing protected old growth habitat.
 Victorian Labor Minister for Environment (etc), 2007-2010 Victorian Labor Minister for Environment (etc), 2007-2010
.
In March 2010, Forests NSW began controversial logging operations in the Mumbulla State Forest, south of Bermagui on the state’s far south coast. Despite being criticised, after a recent survey identified the forest as a key colony for the region’s remaining koala population, Forests NSW Regional Manager Ian Barnes says the logging must go ahead across 240 hectares of the forest, in order to satisfy a supply agreement with the timber industry.
 Deforestation is all about lining ones pockets out of ecological wanton exploitation
It’s a ‘wam bam thank you mam’ approach no different to what the Vikings did to the British in the eight Century.
Colonial Australians and their descendants are doing the same to Australian ecology in the 19th, 20th and 21st Centuries. Deforestation is all about lining ones pockets out of ecological wanton exploitation
It’s a ‘wam bam thank you mam’ approach no different to what the Vikings did to the British in the eight Century.
Colonial Australians and their descendants are doing the same to Australian ecology in the 19th, 20th and 21st Centuries.
Mr Barnes says the logging will not affect the koala habitat. “We’ve taken quite some effort to avoid any possible conflict there,” he says. “As anybody who reads the recent report will know, the koalas have been found in the eastern side of the forest, and our logging is planned for the western part, as far away as we can get from the koalas.”

Despite assurances, anti-logging campaigners have organised a vigil in the forest in an attempt to stop the logging. Conservationist Prue Acton says the activity will devastate the koala population.
“Why risk the only healthy koala colony left in the far south coast. For what? “ she said. “95% of what is going to be logged is going to end up at the Eden woodchip mill, be shipped to Japan for cheap copy-paper. What a disgrace.”
The Greens MP Lee Rhiannon says the Premier should put the protection of koalas ahead of the interests of logging companies. “The New South Wales Government has refused to end logging in the south east native forest but they should step in and stop the destruction of the koala habitat,” she said.
[Source: ‘Logging begins near key koala habitat‘, ABC, 20100330, ^http://www.abc.net.au/news/stories/2010/03/30/2859615.htm?site=southeastnsw]
.
‘Loggers are clearing bushland at rising rate‘
[Source: ‘Loggers are clearing bushland at rising rate’, by Ben Cubby, Sydney Morning Herald, 20111221, ^http://www.theherald.com.au/news/national/national/general/loggers-are-clearing-bushland-at-rising-rate/2399764.aspx?storypage=0]

The amount of bushland being cleared by logging in NSW soared last year to the highest level since state-wide records began in 1988. An area equivalent to 138,400 football fields was cleared for crops, forestry or infrastructure, says a government report.
The Office of Environment and Heritage said the rise in logging was probably cancelled out by regrowth, leading to no net loss of trees, though its most recent survey took place in 2008, before the land clearing spike. It said the reasons for the logging increase were unclear.
”[The] most likely factors relate to market demand and favourable climatic conditions and [they] can be expected to fluctuate over time,” a department spokesman said. ”It is also possible that recent changes in forestry methods are more readily detectable by satellite monitoring.”
Environment groups said the annual vegetation report was evidence that logging companies were operating in an unrestrained manner.
Bushfires remain the biggest destroyer of forests in the state, leading to a net loss of 48,300 hectares in 2010, the report said.
.
But logging activities now come a close second, accounting for the removal of 42,700 hectares of trees in 2010. This is up from 31,000 hectares the previous year, and an average of about 21,000 hectares a year since 1988.
About 21,200 hectares of bushland was cleared in 2010 to make new areas for crops and grazing, while 5300 hectares were cut down to make way for roads, factories and housing.
”The NSW government is currently conducting a review of native vegetation controls,” said the chief executive of the Nature Conservation Council of NSW, Pepe Clarke. ”They should take this report as a warning – what is required are stronger land- clearing laws that do more to protect the environment, not weaker ones.”
The Wilderness Society said the government had ”failed in its promises to restrain land clearing, resulting in rapid and accelerating degradation of wildlife habitat and water catchments.”
The most recent State of the Environment report found that there had been no net loss of ”woody cover” across NSW between 2003 and 2008.
”This is because, although clearing has occurred over that period, there has also been an equivalent amount of regrowth including government sponsored environmental and forestry planting programs conducted by private landholders and state forests, within crown forests areas,” the department said.
”Notwithstanding no net loss over the whole state, some regions have experienced net declines in woody cover.”
The report uses the international definition of ”woody cover”, which includes land at least 20% covered by the crowns of trees higher than 2 metres, a description which would include relatively open country.
The introduction of a satellite monitoring system for land clearing last year appears to have increased the level of prosecution for illegal land clearing on private property. On crown lands, the number of prosecutions has increased threefold, from a low base, since 2007.
In 2010, the government received 471 reports of suspected illegal land clearing.
.
‘Landowners sent satellite images identifying land clearing‘
[Source: ‘Landowners sent satellite images identifying land-clearing’, NSW Department of Environment (etc), Media release: 14 May 2010, ^http://www.environment.nsw.gov.au/media/DecMedia10051404.htm]
.
NSW Department of Environment Climate Change and Water (DECCW) today began a high tech education campaign to encourage compliance with native vegetation laws by sending letters to landholders including before and after satellite pictures identifying land clearing.
DECCW Director-General Lisa Corbyn said the letters were part of an ongoing education program to encourage compliance with the laws and inform landowners of the proper channels available to them if they want to clear native vegetation.
“We’ve been using satellite technology for some time to identify changes in vegetation cover that may warrant further investigation,” Ms Corbyn said.
“Now we are also using the technology as an education tool. From today, advisory letters will be sent to landowners including before and after satellite pictures showing that vegetation has been cleared on their land.”
Ms Corbyn said the letters aim to inform to the landowner that the satellite imagery has picked up that vegetation had been cleared and highlight the proper channels available to them under the legislation to allow clearing of native vegetation, such as property vegetation plans.
The letters support other tools used by DECCW to encourage compliance with the legislation, including strategic investigations, prosecutions, penalty notices, stop work orders, remedial directions, warning and advisory letters.
The letter also alerts landowners to incentive funding available to restore and protect native vegetation on their properties.
The Native Vegetation Act was introduced in 2003 to bring an end to broadscale land-clearing in NSW. Since then, more than 400,000 hectares of native vegetation has been conserved or rehabilitated on private land through property vegetation plans (PVPs) and 1.6 million hectares has been managed for thinning and invasive native scrub management.
.
Over 60 % of the native vegetation in NSW has been cleared, thinned or substantially disturbed.
.
The impacts of native vegetation clearing have included the extinction of 77 plant and animal species, soil erosion, increased dryland salinity and a decline in water quality.’
.
2003: ‘Clearing rate in NSW 116,000 to 216,000 hectares per year: NSW Govt report’
[Source: ‘Clearing rate in NSW 116,000 to 216,000 hectares per year: NSW Govt report’, by Stephanie Peatling, Environment Reporter, Sydney Morning Herald, 20031117, ^http://www.sydneyalternativemedia.com/id64.html]
.
The equivalent of up to 200,000 football fields may be illegally stripped of native trees and grass each year in NSW, figures suggest.
The first estimates on the extent of the clearings, which the Department of Natural Resources field staff prepared for the Government’s vegetation taskforce, suggest the figure could be as high as 100,000 hectares a year. The figures show between 150,000 hectares and 560,000 hectares were illegally cleared between 1997 and 2002.
The advice is the first official guess at NSW’s illegal clearance levels. The highest rates are in the Barwon, Central West and Far West regions where much of NSW’s remaining native vegetation is located.
The figures have shocked environmentalists, who stress the urgency of making changes to the state’s natural resource management system, which Parliament is debating this week.
A Wilderness Society campaigner, Francesca Andreoni, said: “The new system needs to be fair to everyone, particularly farmers doing the right thing.
“The shocking extent of illegal clearing confirms the urgent need for the Government to implement its decision to end broadscale clearing.”
Figures recording the rate of illegal land clearing each year are almost impossible to compile because it so hard to charge people who breach native vegetation laws. There is also a complicated system of exemptions which allow people to clear land for purposes such as maintaining fire access trails.
Monitoring illegal clearing is potentially dangerous for departmental compliance officers. After reports of illegal clearing earlier this year on a property near Nyngan, in the state’s west, department officers were prevented from entering the property by an angry crowd of up to 150 people.
.
When the amount of land illegally cleared is added to land that is legally approved for clearance, the department estimates between 700,000 hectares and 1.3 million hectares of land were cleared between 1997 and 2002.
.
The figures suggest clearing was faster than the Department of Natural Resources’ previously admitted figure of about 60,000 hectares a year. That figure would give NSW the second-highest clearing rate in the country behind Queensland.

Debate on the Government’s package to overhaul native vegetation laws, based on an election promise to end broad-scale clearing, will take place this week. Last month the Premier, Bob Carr, announced a $406 million deal between farmers and environmentalists to end broad-scale clearing.
Most of the money is expected to go towards such things as tree planting and fencing waterways to help counter salinity and erosion. But local authorities may also compensate farmers for not clearing land. Clearing will still be allowed where it is deemed environmentally necessary.
Under the new system, natural resource management is being overhauled. Thirteen catchment management authorities will replace 19 catchment management boards, 20 regional vegetation committees and 33 water management committees.
Scientists often name land clearing as one of Australia’s most urgent environmental concerns. It contributes to soil salinity, loss of biodiversity and greenhouse gas emissions because carbon dioxide is released into the atmosphere when the cleared timber is disposed of, usually through burning.
.
‘Green groups attack logging growth’
[Source: ‘Green groups attack logging growth’, by David Bancroft, My Daily News, 20111229, ^http://www.mydailynews.com.au/story/2011/12/29/green-groups-attack-logging-growth/]
.
Environment groups have banded together to criticise the level of logging occurring in New South Wales. The Nature Conservation Council, The Wilderness Society, National Parks Association, the Northern Inland Council for the Environment and the North Coast Environment Council have issued a joint warning that iconic and endangered species are being threatened by land clearing.
 Illegal deforestation for fire wood, near Taralga, on the western edge of the Blue Mountains
Source: ^http://www.orchidsaustralia.com/article_%20conservation_no3.htm Illegal deforestation for fire wood, near Taralga, on the western edge of the Blue Mountains
Source: ^http://www.orchidsaustralia.com/article_%20conservation_no3.htm
.
In a joint press release, the groups said the NSW annual report on native vegetation released by the Office of Environment and Heritage (Ed. yet another money wasting name change) this month showed 2009/10 was the “worst year on record for clearing of native bushland”.
.
The Wilderness Society campaigns manager Belinda Fairbrother said the report showed that in 2009/10 an area equating to 138,400 football fields was cleared for crops, forestry or infrastructure.
.
“This is higher than any other year since records commenced in 1988 and shows the NSW Government has failed in its promises to restrain land clearing, resulting in rapid and accelerating degradation of wildlife habitat and water catchments,” she said.
North Coast Environment Council president Susie Russell said the report made a sad end to the International Year of Forests.
“The area cleared for forestry in 2009/10 was almost five times greater than it was in 1988/89,” she said.
“It reveals a massive increase in the rate and intensity of logging in NSW, which will be causing untold damage to the extraordinary high diversity forests of north-east NSW.”
Nature Conservation Council chief executive officer Pepe Clarke said land clearing was recognised as the single greatest threat to wildlife in Australia.
“It causes the death of birds and animals, the extinction of species, leads to the poisoning of soils from salinity and makes a major contribution to global warming,” he said.
.
 The Liberal-Labor Party ‘Island Vision’ for Australia’s State Forests
‘The Hill’ (Penrose State Forest, NSW) 2007, drawing by James King The Liberal-Labor Party ‘Island Vision’ for Australia’s State Forests
‘The Hill’ (Penrose State Forest, NSW) 2007, drawing by James King
^http://www.jamesking.com.au/drawings.html
.
Tags: 1788 Colonial Invasion, Cathcart State Forest, deforestation, Eden woodchip mill, fire wood, Forests NSW, Google Earth, hazard reduction, Helicopter Aerial Incendiary, Island Vision for Australian State Forests, koala habitat, land clearing, Logging, Long-footed Potoroo, Murrah/Mumbulla State Forests, not logged yet, Orbost Spiny Crayfish, Powerful Owl, precautionary principle, Sooty Owl, spotted-tailed quoll, State-sanctioned Arson, VicForests, Wielangta State Forests
Posted in Koalas, Owls, Quolls, Threats from Bushfire, Threats from Deforestation, Threats from Farming | No Comments »
Add this post to Del.icio.us - Digg
Thursday, September 15th, 2011
The following article was published on CanDoBetter.net today (20110915) by wildlife ecologist and biologist, Hans Brunner, under the title: ‘A planned slaughter of endangered wildlife’
.

The Victorian Government plans to drop 1080 poison bait from an aircraft into forests could result in the extinction of the already critically endangered Spotted-tailed Quoll.
The purpose of this antiquated and vandalistic method is to poison wild dogs. Why is the Victorian Government using old, dangerous methods? This is like re-introducing the use of DDT. It is now a double disaster; all Ted Baillieu has to do now is to aerial bait to kill wild dogs in order to protect the cattle he allowed to go back into the mountains! Spot-tailed quolls and other dasyurids are meat eaters as well as some species of possums, reptiles, bandicoots and birds. They would be all at a serious risk of being poisoned. Further more, most of this bait would be wasted because of the dogs not being able to find them and this is where non-target animals will rather find and eat them. Baits have therefore to be placed only in places which dogs frequently use, along forest tracks.
.
More effective methods
There is a well researched and efficient method for the poisoning of wild dogs and foxes. It is a target specific bait station system which is successfully used throughout Victoria. Bait stations are placed along forest tracks where activities of dogs are observed.
A bait station consists of a mound of soil about 20 cm high and one meter in diameter. An un poisoned bait (free feed) is buried in the center of the mound about 10cm deep with some SFE lure placed on top. When the bait has been dug up and eaten, a check is made, with some experience, to assess whether a dog or fox took the bait. If satisfied that a target species took the bait it can be replaced with a poison bait. If it appears that a quoll or an other non-target animal may have taken the free feed bait, continue free feeding that station to keep the quoll and others away from a poison station (about 2 km away) or eliminate that station.
.
This is the only responsible way to poison dogs and foxes. Even better, it will be of great benefit to not only the quolls by removing the competition by dogs and foxes of their natural prey species, but also for the survival of Kangaroos, wallabies, bandicoots, possums, echidnas etc.
.
Biologist’s experience of alternatives
I have researched and tested this system in 700 square km of forest between Gembrook and Neerim and found it most effective and efficient. I have also introduced it in NSW National Parks where it was recognized as “The dog baiting stations proposed by Hans are the best practical suggestion to date. With the implementation of the bait stations, properly maintained and serviced at the appropriate times, there would appear to be NO reason to allow the continued use of aerial baiting” and, “Poisoning using the buried bait technique is still proving extremely target specific, with dogs and foxes being the only species killed”.
.
Do it the right way and wildlife return
Barbara Triggs, an eminent naturalist stated after poisoning wild dogs and foxes and using the bait station system on her property in Croajingolong National Park, East Gippsland:
.
“At no time has there been any evidence that a bait has been taken by a non-target animal. In the past year the numbers of native animals seen on the property have increased startlingly. The Red-necked Wallabies, who’s group was here in low numbers, have increased markedly from five individuals to now at least fourteen. The most surprising increase has been in the population of Long-nosed Bandicoots. The Dusky Antechinus, Swamp Rats, Water Rats, Sugar Gliders and several species of ground-nesting birds and also species of owls are much more in evidence than ever before.”
.
With all this evidence, this non specific and irresponsible aerial baiting must be immediately stopped.’
Hans Brunner
Wildlife biologist
Sept 2011
Tuesday, June 14th, 2011
") This is a Tiger Quoll (Dasyurus maculatus) This is a Tiger Quoll (Dasyurus maculatus)
Photo courtesy of Sean McClean.
.
It is Australia’s largest carnivorous marsupial on the mainland and it has become endangered because of humans destroying its habitat, shooting it and poisoning it.
It is not a cat. Much information may be obtained online simply by typing ‘tiger quoll’ on Google.
.
.
.
The following extract is from the website ‘Convict Creations‘ (15-Feb-2010):
‘Tiger Quoll…the next to die’
“Without disrespecting the Koala or Kangaroo, the Tiger Quoll is one of Australia’s most interesting animals. It sort of resembles a cat except it has a pouch, bright eyes, a moist pink nose and a powerful bite. It can grow to up to 75 cm in length and weigh up to 7kg. If trained, it will even use a kitty litter tray.
The Tiger Quoll is the type of animal that tourists would love to see on their Australian safari.
Unfortunately, they are quite rare so few have ever caught a glimpse of them.
European colonisation of Australia could have been great for the Tiger Quoll. With Europeans introducing rabbits, rats and mice, the Quoll saw a drastic increase in its food source. Had the colonists warmed to them, then a mutually beneficial relationship could have formed. Farmers could have encouraged Quolls to take up residency in order to keep rodent numbers down with little fear that their livestock would be in danger. As an added bonus, by eating carrion, the Quolls would have reduced the threat of blowfly strike.
Alternatively, they could have just made pets out of the Quoll. Apparently the Quoll has all the positive characteristics of a cat or dog. According to Professor Mike Archer, Former Director of the Australian Museum, who once kept a Quoll as a pet:
“I just can’t praise these animals highly enough as companions for human beings. They have all the good features in dogs and cats, and in my experience not a single downside”.
If colonial owners had taken care of their Quolls, then both Quoll and owner would have been happy. If not, the Quoll would have just escaped and done Australia a service by cleaning up decaying meat, rabbits and other introduced vermin.
Unfortunately, colonists never formed mutually beneficial relationships with the Quoll. Instead, they introduced the cat to serve the role of pest controller. For more than a century, farmers deliberately released cats onto their properties in order to control rabbit and mice populations. Once the cats went feral, they started to compete with the Quoll for food. Although the Quoll was better adapted to Australia’s cycle of droughts, the cat’s symbiotic relationship with humans proved to be an even better environmental adaptation. If feral cats were ever wiped out in a drought, or declined for whatever reason, they still had the family home as an oasis in the desert. From the family home, they were well placed to repopulate the bush once good conditions returned.
Even worse than competition from the cat were the environmentalists’ attempts to “help” them. The use of 1080 poison has been one of the main helping strategies. When it is used to kill rabbits, it indirectly deprives Quolls of food. So much so, by killing rabbits, human deprive Quolls of even more food than is lost due to competition by cats. To compound matters, when 1080 poison is used to kill the cats and foxes competiting with Quolls, it also ends up being eaten by Quolls. In fact, Quolls are more likely to eat the poisons because they have a keen nose for carrion while the feral predators prefer fresh kills.
A very odd example of the misguided environmental policy was recently seen in in Tasmania. 1080 was first used to reduce rabbit numbers. A rumour then developed that foxes had finally established a breeding community in the island state. Even though it was just a rumour, to be on the safe side, environmentalists decided a large scale baiting regime needed to be implemented to eradicate foxes as well. On the State Government’s own data, more than 140,000 poison baits were laid. So far, there has been no evidence that foxes were actually present. There was; however, plenty of evidence of Quoll dying!
The odd wilderness protection policy caught the attention of David Obendorf, a vet with a research focus in marsupial diseases. According to Obendorf:
“Three Tasmanians have each offered $1,000 fox rewards (Tasmanian Times: “$1,000 fox reward”). All remain unclaimed despite farmers, landowners and professional shooters all knowing about them. And yet the government “guessimate” claims there are up to 400 foxes living in Tasmania … somewhere. In my opinion Tasmania’s use of 1080 poison over the last five decades – to kill browsing and grazing native herbivores – has had a significant effect on the over-population followed by the facial tumour disease-crash in devil numbers and in the widespread establishment of feral cats across the island….Ironically the state government has now ceased the use of 1080-laced carrot/apple baits on public lands to kill grazing wildlife but now uses tens of thousands of meat baits in public forests where they claim they are targeting those cryptic foxes.” (1)
The use of 1080 poison could be legitimately referred to as Australia’s dumbest environmental policy since the construction of a 1,833 km fence to “keep” rabbits out of WA. It seems that Western Australians weren’t smart enough to realise that rabbits can dig under fences. All that was required was for a single pregnant female to dig a hole and then 1,833 km of fence line would be obsolete. Perhaps WA politicians did in fact realise the folly of it all, but decided it was more to important to show they were “doing something”.
As an added bonus, “doing something” kept people in regional Australia employed. Perhaps 1080 poison is used for similar reasons. Unfortunately, “doing something” to help Quolls is really not helping them at all. It forces them into wilderness reserves where scientists can erect huge fences to keep out ferals and then make a lucrative income maintaining them. (2)
Even though the Tiger Quoll is mainland Australia’s largest native predator, Australia doesn’t have any professional sporting team named after them. In fact, they don’t really exist in public consciousness in any significant shape or form. Perhaps this is because Quolls spend their time out in the bush where they are only ever seen by rangers.
Alternatively, perhaps the name Quoll just isn’t scary enough.
Zoos – The only real industry is as a research subjects by scientists, or to provide an endangered animal story that can be used by wilderness groups to write emotive appeals asking for funding to save them.
Pest controllers – Potentially, Quolls could make great pest controllers. They could compete with cats and foxes for food, and eliminate rabbits and rats in the process. Landowners could breed them and sell them as a substitute to 1080 poison.
Pets – Sometimes scientists have made great pets out of Quolls. At present, the general public is not allowed to do likewise. The general argument is that Quolls require special care that only a scientist can give. Consequently, Australians have to reserve their abusive ownership methods for dogs and cats that simply go bush if they are unhappy with their owners.”
.
.
The Snowy River is a surviving stronghold of the Tiger Quoll
.
“In East Gippsland, the areas on the Errinundra Plateau, Snowy River and Tingaringy are strongholds of the Spot-tailed Quoll”. (GECO)
“The Upper Snowy River and its tributaries was the Victorian stronghold of the Tiger Quoll before (the 2003) devastating Alpine bush fires. The Tiger Quoll is believed to have lost up to 75% of an estimated population of 1,000 in the area.
Following the devastating effects of recent bush fires The Tiger, or Spotted-tailed Quoll (Dasyurus maculatus) has been reclassified as nationally endangered. it is feared that the fires will have a lasting effect on the Quolls that remain.”
.
.
.
References:
[1] ABC, ^http://www.abc.net.au/rn/science/earth/stories/s145805.htm
[2] David Obendorf – ^http://www.animal-lib.org.au/news/1080–the-real-killer.htm”
[3] ^http://www.fame.org.au/current_projects.html
.
~ article by Tigerquoll, first published on CanDoBetter.net 15-Feb-2011
|
|
 19th Century heritage-listed ‘Six Foot Track’
..bulldozed by the Rural Fire Service in July 2005, widened into a convenient Fire Trail for its fire truck crews.
19th Century heritage-listed ‘Six Foot Track’
..bulldozed by the Rural Fire Service in July 2005, widened into a convenient Fire Trail for its fire truck crews.
 Spotted-tailed Quoll
(Dasyurus maculatus)
Blue Mountains top order predator, competing with the Dingo
Spotted-tailed Quoll
(Dasyurus maculatus)
Blue Mountains top order predator, competing with the Dingo


")
")


")


")