Taxing Air – daring to question ‘Climate Change’
Thursday, June 27th, 2013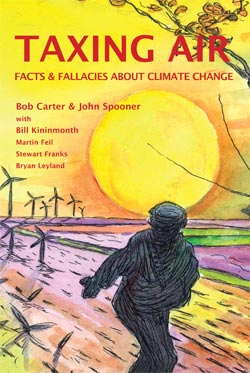 ‘Taxing Air : Facts & Fallacies about Climate Change’
A new book by leading environmental scientist Professor Bob Carter
and political cartoonist John Spooner, with Bill Kininmonth, Martin Feil, Stewart Franks, Bryan Leyland.
‘Taxing Air : Facts & Fallacies about Climate Change’
A new book by leading environmental scientist Professor Bob Carter
and political cartoonist John Spooner, with Bill Kininmonth, Martin Feil, Stewart Franks, Bryan Leyland.
.
Book released in June 2013:
<< In this accessible and beautifully produced full colour book, The Age (newspaper’s) brilliant political cartoonist John Spooner and leading environmental scientist Professor Bob Carter combine with colleagues to answer a series of critical and highly controversial questions about the politics and science of climate change.
Are human industrial carbon dioxide emissions causing dangerous global warming?
If it is so then climate change surely is one of the great moral challenges of our time.
But is it possible that the so-called consensus science around global warming produced by lavishly funded research institutes and with its own international political lobby organization – the United Nations Intergovernmental Panel on Climate Change (IPCC) – is wrong?
Could it be that the emperor has no clothes?
 Climate Change Alarmism
Continues to invoke taxpayer billions to be wasted
without stopping the culprit, Pollution – notably worst from coal power, road traffic, petro/chemical industry, landfill into oceans…
Climate Change Alarmism
Continues to invoke taxpayer billions to be wasted
without stopping the culprit, Pollution – notably worst from coal power, road traffic, petro/chemical industry, landfill into oceans…
.
<< Accessible, clearly written and illustrated with simple scientific illustrations, and accompanied by Spooner’s brilliantly wry and telling cartoons, Taxing Air answers – without the spin, evasions or propaganda that pollutes most official writing on climate change – every question you have about global warming but have been too intimidated by the oppressive ‘consensus’ to ask. >>
.
..Did You Know?
.
• Just 8,000 years ago, there was virtually no summer sea-ice in the Arctic Ocean.
• Sea-level rise is natural, and declining in rate.
• Australian rainfall has not decreased over the last 100 years.
• A previous Australian drought lasted 69 years.
• By catchment management, the Murray-Darling Basin now contains almost 3 times as much water as it held naturally.
• Global air temperature has not increased for the last 16 years, despite an 8% increase in CO2.
• Global ocean temperature is also steady or cooling slightly.
• Australian territory absorbs up to 20 times the amount of CO2 that we emit.
• The CO2 tax will cost about $1,000/person/year; and rising.
• The result of reducing Australian CO2 emissions by 5% by 2020 will be a theoretical (and unmeasurable) cooling of between 0.0007 O and 0.00007 O C by 2100.
• No scientist can tell you whether the world will be warmer or cooler than today in 2020.
.
Just a selection of the fascinating facts provided in answer to more than 100 basic questions about global warming and climate change that are covered in the book. >>
.
[Source: ‘Bob Carter’s new book: “Taxing Air” – climate change facts and fallacies‘, 201306, Australian Conservative, ^http://australianconservative.com/2013/06/bob-carters-new-book-taxing-air-%E2%80%93-climate-change-facts-and-fallacies/].
[Ed: Yet while they tax air in the name of Climate Change,
Weak Environmental Laws exacerbate pollution]
.
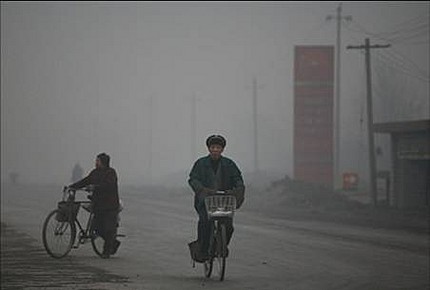
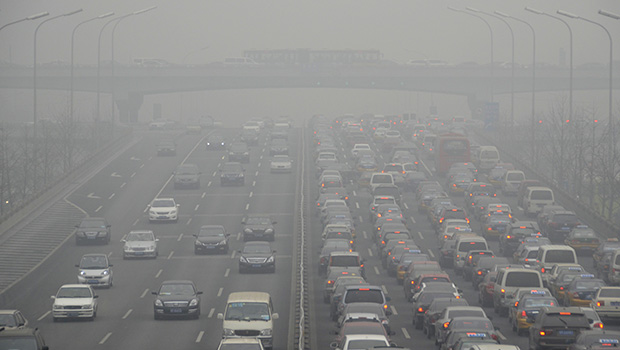 Simple old fashioned Pollution is ignored in favour of Climate Change Evangelism
Where is the Pollution Alarmism? It is real. You can touch and taste it!
Simple old fashioned Pollution is ignored in favour of Climate Change Evangelism
Where is the Pollution Alarmism? It is real. You can touch and taste it![Source: ‘Beijing China motorway smog pollution January 2013, by Getty’s Images, ^http://www.newstalkzb.co.nz/auckland/news/nbint/1347280267-smog-envelops-huge-swathes-of-china]
.
James Cook University caves in to Climate Change Evangelism and Bullying
.

So much for “higher” education.
James Cook University (in Townsville, Far North Queensland, Australia) has blackballed Professor Bob Carter, not because of any flaw in his scientific reasoning, but because he speaks outside the permitted doctrine. His views on climate science do not fit with the dominant meme (or the grant applications). And then there were pesky complaints and emails from disgruntled fans of the prophets-of-doom. (Quite a drain on the office.)
They took his office a while back, then they took the title. Carter was still supervising a student, and another professor hired him for an hour a week with his own budget. It meant Carter could continue supervising and keep his library access. But that wouldn’t do. Professor Jeffrey Loughran blocked that as well. The library pass and the email was shut off on June 21. It takes an active kind of malice to be this petty.
.
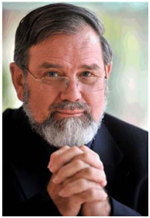 Professor Bob Carter
.
In years to come when everyone admits that the Great Global Warming Scare was hyped, James Cook University (JCU) could have been seen as one of the rare beacons of academic honour and principle. Instead, apparently, it’s as spineless as any other bureucratic collective. The irony for James Cook University, is that Bob Carter has been working there for 31 years, and they only had to put up with him for a little bit longer in order to claim their glory (albeit post hoc) and then pretend that really they had supported him all along.
The dominant meme is collapsing, thousands of respected scientists are speaking out and skeptic blogs are storming the awards. The evidence has turned, the carbon market has sunk to junk status, and assertive daring articles are appearing in mainstream media in places they would never have been seen a few years ago, like the New York Times, and the Economist. The climate scientists themselves are admitting they don’t know why the world isn’t warming. But the man who was right about that all along is persona non-gratis.
Professor Bob Carter has been a key figure in the Global Warming debate, doing exactly what good professors ought to do, challenging paradigms, speaking internationally, writing books, newspaper articles, and being invited to give special briefings with Ministers in Parliament.
He’d started work at James Cook University in 1981 and served as Head of the Geology Department until 1998. [UPDATE: to clarify, sometime after that he retired]. Since then he’s been an honorary Adjunct Professor.
All James Cook University had to do was to approve an extension of this arrangement, giving him library and email access, at little cost to them, and he could have continued to help students and staff, provide a foil, a counterpoint, and keep alive the spirit of true scientific enquiry. (Not to mention his continued speaking, books, and influence on the National debate).
Instead every person in the chain of command tacitly, or in at least one case, actively endorsed the blackballing. Each one failed to stand for free speech and rigorous debate. In the end, James Cook University didn’t even make any effort to disguise the motive. The only reasons given were that the staff of the School of Earth and Environmental Studies had discussed the issue (without any consultation with Carter) and decided that his views on climate change did not fit well within the School’s own teaching and research activities.
Apparently it took up too much time to defend Carter against outside complaints about his public writings and lectures on climate change. (Busy executives don’t have time to say “Why don’t you ask Carter yourself?” or “We value vigorous debate here.” Presumably they are too busy practising their lines and learning the litany? )
Each of these eminent professors, no doubt, is certain that they are independent minded, tolerant of other views, and have exacting ethical standards. I gather any one of them could have risen above the lap-dog obedience to the dogma of the day.
None did. >>
.
[Source: ‘JCU caves in to badgering and groupthink — blackballs “politically incorrect” Bob Carter‘, 201306, by Joanne Nova, ^http://joannenova.com.au/2013/06/jcu-caves-in-to-badgering-and-groupthink-blackballs-politically-incorrect-bob-carter/].
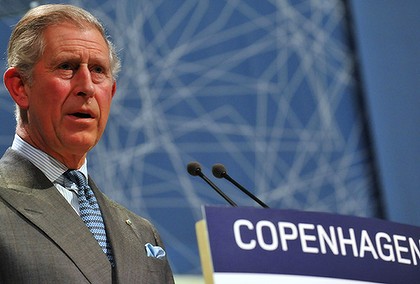 Jet A1 gusling hypocrites fly globally
to attend Climate Change talkfests like the failed Copenhagen Summit in 2009
[Source: ‘Hypocrite Prince Charles slammed for flying to Copenhagen in jet with large carbon footprint’, 20091217,
^http://www.smh.com.au/environment/climate-change/hypocrite-prince-charles-slammed-for-flying-to-copenhagen-in-jet-with-large-carbon-footprint-20091217-kxzl.html]
Jet A1 gusling hypocrites fly globally
to attend Climate Change talkfests like the failed Copenhagen Summit in 2009
[Source: ‘Hypocrite Prince Charles slammed for flying to Copenhagen in jet with large carbon footprint’, 20091217,
^http://www.smh.com.au/environment/climate-change/hypocrite-prince-charles-slammed-for-flying-to-copenhagen-in-jet-with-large-carbon-footprint-20091217-kxzl.html]
.
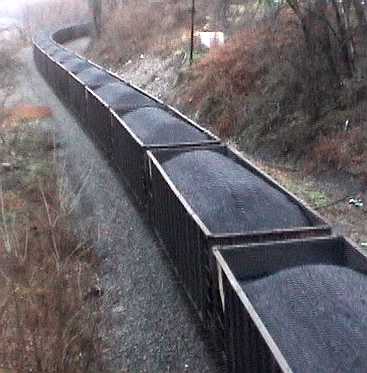
And while Australia scaremongers Climate Change, Coal remains King
.
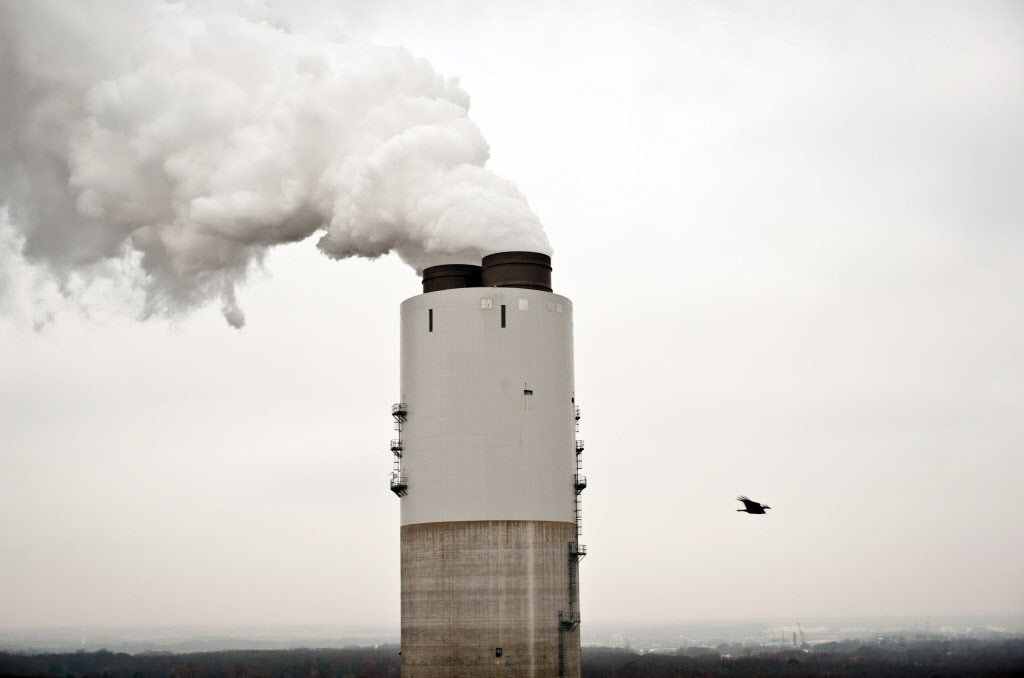 Coal Fired Power Pollutes worse than Climate Change
[Photo: http://www.cleveland.com/business/index.ssf/2012/03/epa_to_reduce_new_power_plants.html]
Coal Fired Power Pollutes worse than Climate Change
[Photo: http://www.cleveland.com/business/index.ssf/2012/03/epa_to_reduce_new_power_plants.html]
Australia’s Pollution Fact Sheet
.
1. Australia is the world’s #1 Developed Nation polluter
Consulting the US Energy Information Administration database (see: http://www.eia.doe.gov/ ) we obtain the following information on “annual per capita fossil fuel-derived carbon dioxide (CO2) pollution” in “tonnes (t) per person per year” for Australia and other major polluters (2004 data): 19.2 (for Australia; 40 if you include Australia’s coal exports), 19.7 (the US), 18.4 (Canada), 9.9 (Japan), 4.2 (the World), 3.6 (China), 1.0 ( India) and 0.25 (for Bangladesh).
.
2. Germanwatch index places Australia #54 in the list of the worst polluters (#56 being worst)
Of course “annual per capita fossil fuel-derived CO2 pollution” is but one – albeit a very important – indicator of climate impact. The Germanwatch Climate Change Index 2008, a comparison of the 56 top CO2 emitting nations (see: http://www.germanwatch.org/ccpi.htm ), takes other parameters into account in ranking. In this ranking of 56 top CO2 emitting nations, Sweden and Germany are #1 and #2 for greenhouse responsibility, while shale-oil-rich Canada (a US ally), coal-rich Australia (a US ally), the USA and oil-rich Saudi Arabia (US-linked) rank #53, #54, #55 and #56, respectively (see: http://www.germanwatch.org/ccpi.htm ).
.
3. In 2004 Australia (0.3% world population) gave 3% total fossil fuel
Consulting the US Energy Information Administration database (see: http://www.eia.doe.gov/ ), in 2004 Australia (0.3% world’s population) yielded 1.4% of world’s fossil fuel-derived CO2 (3% including coal exports). The World’s 27,043 Mt fossil fuel-derived CO2 (2004) comprised 10,850 Mt (petroleum), 5602 Mt (gas), and 10,592 Mt (coal) with the Australia breakdown being 810 Mt (total), 117 Mt (petroleum), 52 Mt (gas), 217 Mt (coal, domestic), 424 Mt (coal exports).
.
4. Australia world’s largest coal exporter (30% total world coal exports)
From Australian Coal Association (see: http://www.australiancoal.com.au/exports.htm ) Australia maintained its position as the world’s largest coal exporter with exports of 233 Mt in 2005-06 ($A24.5 billion) or 30% of the world total (777 Mt) (M, G, T = million, billion, trillion).
.
5. Australia produces about 6% of world hard coal (black coal)
From World Coal Institute (see:
http://www.worldcoal.org/pages/content/index.asp?PageID=188 ) total World: hard coal consumption 5339 Mt (2006); coal production 5370 Mt (2006); World brown coal 914 Mt ; Australia 309 Mt hard coal (5.8% of World production; used for thermal electricity and as coking coal for steel production).
From Australian Minerals Index (see:
http://www.australianminesatlas.gov.au/build/common/siteindex.jsp ) Australia produces about 6% of the world’s saleable black coal and is ranked fourth after China (45%), US (19%) and India (8%).
.
6. Australia has 24% of World’s brown coal and produces 8% of World’s Total
From Australian Minerals Index (see: http://www.australianminesatlas.gov.au/aimr/commodity/brown_coal.jsp )
Australian brown coal production for 2005/06 was 67.7 Mt (valued at $849 million) – all was from Victoria and used to generate electricity. Australia has about 24% of World recoverable brown coal and is ranked first. However, Australia produces about 8% of the World’s brown coal and is ranked fifth largest producer after Germany (22%), Russia (10%), USA (9%) and Greece (8%).
.
7. Australian coal reserves
Australia has about 77 billion tonnes of coal resources
http://gc3.cqu.edu.au/modern-world/index.php . There are 909 billion tonnes of proven coal reserves worldwide (see: http://www.worldcoal.org/pages/content/index.asp?PageID=100 ). The price in 2006 was about US$100/t but is expected to reach US$300/t in 2008.
.
8. Coal to CO2 and coal to kWh conversions
Carbon (C, atomic weight 12) to carbon dioxide (CO2, molecular weight 44 ) conversion involves a stoichiometry of 12 g C -> 44 g CO2 i.e. 1 g C to 3.7 g CO2. 1 g coal yields about 1.9 g CO2 (depends on coal type). Thus the US Energy Information Agency estimates World total CO2 from energy-related coal burning at 12,898 Mt in 2008 (see: http://tonto.eia.doe.gov/ask/environment_faqs.asp#source_by_fuel ) and the World Coal Institute estimates 2008 coal production at 5,845 Mt hard coal and 951 Mt brown coal/lignite (see: http://www.worldcoal.org/resources/coal-statistics/ ), this yielding 12,898 Mt CO2/6,796 Mt coal = 1.9 Mt CO2/Mt coal, the specific values for different kinds of coal being 2.85 Mt CO2/Mt coal (anthracite), 2.47 Mt CO2/Mt coal (bituminous), 1.86 Mt CO2/Mt coal (sub-bituminous) and 1.40 Mt CO2/Mt coal (lignite, brown coal) (see: http://www.eia.doe.gov/oiaf/1605/coefficients.html ). In a coal-fired power station 0.327 kg coal yields 1 kWh (kilowatt hour) of energy.
Greenlivingpedia (see: http://www.greenlivingpedia.org/Australian_coal_exports ) estimates that in 2008 Australia exported 288 Mt CO2/120 Mt thermal coal (2.4 Mt/Mt thermal coal) and 238 Mt CO2/140 Mt coking coal ( 1.7 Mt CO2/Mt coking coal) for an average value of 526 Mt CO2/260 Mt coal (and an average value of 2.0 Mt CO2/Mt coal exported from Australia).
.
A further estimate comes from 12,064 Mr CO2 from coal in 2006 (see US EIA: http://www.eia.doe.gov/iea/carbon.html ) and World production of 6779 million short tons of coal (6779 x 0.9072 = 6,150 Mt of coal) in 2006 (see US EIA: http://www.eia.doe.gov/emeu/aer/txt/ptb1114.html ) – 12,064 Mt CO2 /6,150 Mt coal = 1.96 or about 2.0 Mt CO2 per Mt coal (this includes brown coal and low quality sub-bituminous coal in the denominator and would thus would underestimate the CO2 from the burning of exported Australian coal).
.
9. Australia gets 77% of its electricity from coal, 92% from fossil fuels
According ot the Australian Uranium Association (see: http://www.uic.com.au/nip37.htm ) electricity generation in Australia involves about 51 billion W (51 GW) capacity; the price varies during the day etc at about 4 c /kWh; in 2006 Australia’s power stations produced 255 billion kilowatt hours (trillion Wh = TWh) of electricity; the energy source breakdown was 92.2% Carbon-based (black coal 54.8% , brown coal 21.9%, oil 1.3%, gas 14.2%, hydro 6.8%. and renewables 1%; 77% is coal-based electricity.
.
10. The true cost of coal energy is 4 times the market cost (Ontario Government study) – 4,860 Australians killed by coal annually @ $1.6 million each?
In Ontario (see: http://www.evworld.com/news.cfm?newsid=8836) the cost/kWh jumped from $0.04 to $0.164 with environmental and human impacts added; pollution from coal plants producing 27 TWh/year (20% of supply) kill 668 people per year in Ontario (population 12.2 million) suggesting coal plants producing 77% of Australia’s annual 255 TWh of electricity (see: http://www.uic.com.au/nip37.htm ) i.e. 0.77 x 255 = 196.4 TWh/year might kill about 196.4 TWh x 668/27 TWh = 4,859 people annually in Australia (population 21 million); in Australia 255 bn kWh x $0.04/kWh = $10.2 bn; 0.77 (coal-based) x $10.2 bn = $7.85 billion; $7.85 bn /4,859 deaths i.e. Australian electricity consumers pay for electricity @ $1.6 million per fellow Australian killed by coal. >>
.
[Source: ‘Yarra Valley Climate Action Group (YVCAG)’, 200806, ^https://sites.google.com/site/yarravalleyclimateactiongroup/%E2%80%9Ccoal-is-king%E2%80%9D-australia-co2-pollution-fact-sheet]
Australia is the world’s leading coal exporter !
.
<< Over the past 10 years black coal exports have increased by more than 50%.
Japan takes 39.3% of Australia’s black coal exports – the largest share, with a total of 115.3 million tonnes exported last financial year.
China is our second largest market with 42.4 million tonnes in 2009-2010, almost double the previous year.
The Republic of Korea accounts for 40.7 million tonnes, India for 31.92 million tonnes and Taiwan for 26.53 million tonnes, rounding out the top five destinations for coal from Australia.
Together these five countries accounted for 88% of all black coal exports with a further 28 countries taking the remaining 12%.
Demand for coal in China and India is expected to increase dramatically over the next decade in line with these countries’ projected need for coal for energy and manufacturing.
Australia was the only one of the world’s 33 advanced economies to grow in 2009 during the worst global recession since the Great Depression.
The principal reason for this was our continued coal exports. The importance of coal in the economy is also evident in its growing share of Gross Domestic Product.
This share has more than doubled, from 1.7 % in 2006-07 to 3.5 % in 2008-09, making it the largest contributor to the mining sector.
In 2011, Australia’s thermal coal exports grew by four %, relative to 2010, to total 148 million tonnes. Projections for 2012 see an increase of 10% in 2012 to 162 million tonnes, then growing at an average annual rate of 11 % between 2013 and 2017, to total 271 million tonnes by the end of the period.
Australia’s exports of metallurgical coal are forecast to increase at an average annual rate of eight %, reaching 218 million tonnes in 2017, with total earnings forecast at $40 billion in current Australian dollars..
Looking to purchase coal?
Please contact our members for further information. >>

.
[Source: The Australian Coal Association, ^http://www.australiancoal.com.au/exports.html].
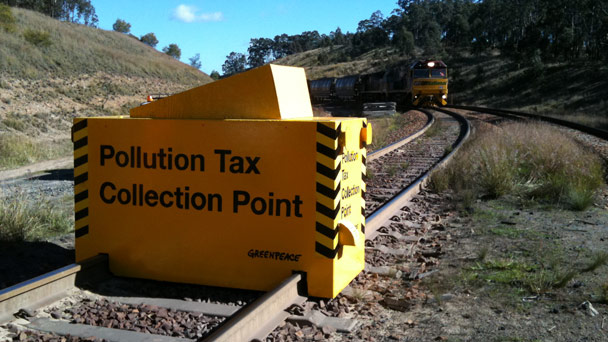 If pollution causes climate change and coal is the worst polluter, why is Australian Coal not pollution taxed?
[Source: Greenpeace, ^http://www.greenpeace.org/australia/en/news/climate/Coal-train-stopped-in-tracks1/]
If pollution causes climate change and coal is the worst polluter, why is Australian Coal not pollution taxed?
[Source: Greenpeace, ^http://www.greenpeace.org/australia/en/news/climate/Coal-train-stopped-in-tracks1/]
.
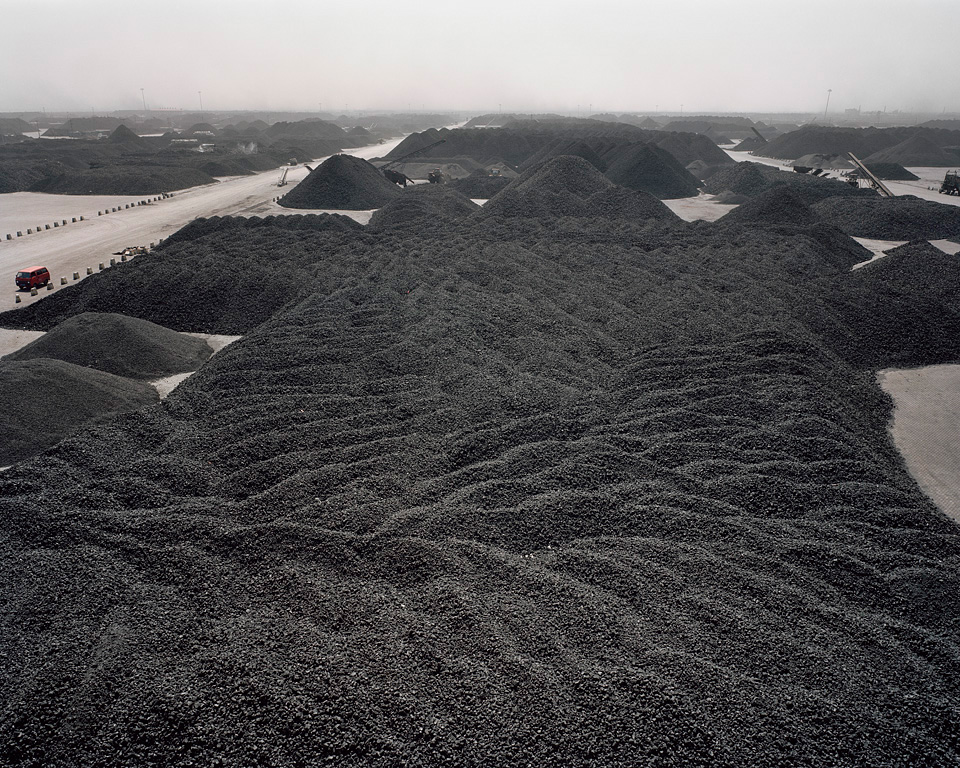 Chinese Coal
[Source: Econews, ^http://econews.com.au/news-to-sustain-our-world/greenpeace-china-coal-plan-may-spark-water-crisis/]
Chinese Coal
[Source: Econews, ^http://econews.com.au/news-to-sustain-our-world/greenpeace-china-coal-plan-may-spark-water-crisis/]
.
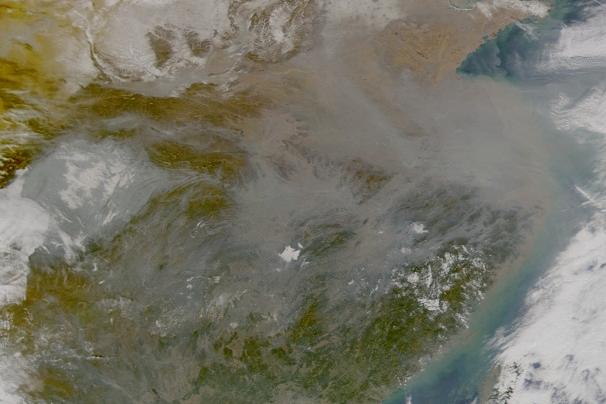 Haze and sulfur aerosol pollution produced by China unnaturally.
[Source: NASA]
Haze and sulfur aerosol pollution produced by China unnaturally.
[Source: NASA]
.
 Pollution impacts on China
[Source: ^http://splashman.phoenix.wikispaces.net/East+Asia+Environmental+Issues,+RS]
Pollution impacts on China
[Source: ^http://splashman.phoenix.wikispaces.net/East+Asia+Environmental+Issues,+RS]
.
.
.
Further Reading
.
[1] “Taxing Air” – climate change facts and fallacies’
For more information about this book, including how to order go to: ^www.taxingair.com.
.
[2] “Axe the tax”and “adapt to the fact” of climate change, Professor Bob Carter says’
.
[3] ‘Gillard’s climate committee is a farce, Bob Carter says’
^http://australianconservative.com/2010/11/gillards-climate-committee-is-a-farce-bob-carter-says/
.
[4] ‘Prof Bob Carter reviews the climate debate and Gillard Govt’s irrational response’
.
[5] ‘Bob Carter on the climate counter-consensus’
^http://australianconservative.com/2010/05/prof-bob-carter-on-the-climate-change-counter-consensus/
.
[6] ‘ “Their” ABC gags climate realist Bob Carter’
^http://australianconservative.com/2010/03/their-abc-gags-bob-carter/
.
[7] ‘Politicians miss the point on climate change’
^http://australianconservative.com/2010/08/politicians-miss-the-point-on-climate-change/
.
[8] ‘100 reasons why climate change is natural’
^http://australianconservative.com/2009/12/100-reasons-why-climate-change-is-natural/
.
[9] ‘The World’s Worst Pollution Problems: Assessing Health Risks at Hazardous Waste Sites’
2012, by Blacksmith Institute and Greencross Switzerland
>World’s Worst Polluted 2012 (4MB, PDF)
^http://www.worstpolluted.org/files/FileUpload/files/2012%20WorstPolluted.pdf
[10] Who are the world’s biggest polluters?
^http://www.reuters.com/news/pictures/slideshow?articleId=USRTXRKSI#a=1
.
[11] Eleven Most Polluted Rivers in the World (by Humans)
^http://www.takepart.com/photos/10-most-polluted-rivers-world/lake-karachay–russia
")