Archive for August, 2010

Australian National Wattle Day: 1st Sept.

Tuesday, August 31st, 2010

by Editor 20100831.

Australia’s Wattle Day Centenary (1910-2010)
is being celebrated on Wednesday 1 September 2010.

The Wattle flower is uniquely Australian.  It is a plant genus ‘Acacia‘ native to Australia.  That it is natural to Australia has made it ideal as a recognised and universally accepted Australian symbol.  The ‘Golden Wattle‘ (Acacia pycnantha) in particular is Australia’s Floral Emblem and is an integral part of the Australian Coat of Arms.

‘The first known use of wattle as a meaningful emblem in the Australian colonies dates back to the early days of Tasmania (1838), when the wearing of silver wattle sprigs was encouraged on the occasion of an anniversary celebration of the seventeenth century European discovery of the island.’      [Wattle Day Association]


Australian Coat of Arms

‘The first granting of armorial bearings to the Commonwealth of Australia was made in 1908. A new design was granted by Royal Warrant on 19 September 1912. The branches of wattle used as an ornamental accessory to the shield, representing the badges of the six States as they were in 1912, were not mentioned in the blazon, but were depicted in the coloured illustration included in the gazettal of the Australian armorial bearings. The wattle depicted has clusters of spherical flowerheads coloured yellow and blue-grey, and green phyllodes characteristic of many species of Acacia. It is not a botanically accurate representation of Acacia pycnantha ( ‘Golden Wattle’).


Order of Australia

The Order of Australia is part of the Australian system of honours and awards formally recognising achievement or meritorious service to the Australian nation.  The designs of the insignia of the Order are based on an individual ball of wattle flowers. The insignia are convex golden discs adorned with beads and radiating lines, and surmounted by an enamelled crown, signifying the traditional role of the Queen as Sovereign Head of the Order.  Blue ribbons decorated with golden wattle motifs complete the insignia in which the colours that predominate, blue and gold, represent the sea which surrounds Australia and the colour of the popularly accepted national flower. The blue and gold wreath surmounting the shield in the armorial bearings of Australia is described in the blazon, ‘for the Crest On a Wreath Or and Azure. . .’

Australians representing their country in international sporting events usually wear the national colours, green and gold, said to be based on wattle foliage and flowers.


Australian Patriotism

‘In the spirit of national and patriotic fervour generated by the approach of Federation, achieved in 1901, public interest in the Australian environment was awakened and the search for a national identity brought the desire for national symbols.

‘Archibald Campbell founded a Wattle Club in Victoria in 1899 to promote a Wattle Day demonstration every September to encourage recognition of the flower as a symbol of patriotism. In 1908 he delivered a lecture entitled ‘Wattle Time; or Yellow-haired September’ in which he stated that ‘by numbers, the Wattle is almost exclusively Australian, and should undoubtedly be our National Flower’. Interest in a national Wattle Day was revived in Sydney in 1909. Victoria and South Australia participated in 1910, and Queensland in 1912.

‘At the same time R. T. Baker, botanist and museum curator, advocated the choice of the Waratah, Telopea speciosissima as the Australian national flower. He wrote:

    “The expression ‘the land of the Waratah’, applies to Australia and no other; it is Australia’s very own. In the Wattle, Australia has not a monopoly like the Waratah, for Africa has over one hundred native wattles, and it also occurs in America, East and West Indies and the Islands. Then again it is not too much to say that throughout the whole botanical world the Waratah is probably unsurpassed as a flower for decorative purposes, and it is impossible to so conventionalise it out of recognition a great feature in a national flower.”

‘In 1911 the Evening News in South Australia reported indignant local reaction to a report ‘that South Africa has commandeered the yellow flower (wattle), and proposes to use it for patriotic purposes’ and supported the choice of the Waratah as the Australian national flower, noting its tangible features of strength, beauty and colour and its symbolic qualities of health, firmness, endurance and independence.

‘The adoption of wattle as the national flower tends to be confirmed by its introduction into the design of the Australian armorial bearings on the recommendation of the Rt Hon. Andrew Fisher, Prime Minister of Australia, when the Commonwealth Armorial Ensigns and Supporters were granted by Royal Warrant on 19 September 1912.’

The conflict which existed about the choice of the Australian national flower is seen in the inclusion of both waratah and wattle flowers as decoration on the three golden trowels used by the Governor General, Lord Denman, the Prime Minister, the Rt Hon. Andrew Fisher and the Minister for Home Affairs, the Hon. King O’Malley, for the laying of foundation stones of the commencement column in Canberra, the national capital, on 12 March 1913.
 
[Source:  Australian National Botanic Gardens, ^http://www.anbg.gov.au/emblems/aust.emblem.html ]


Australians in the Great War  [1914-1918]


“During World War I, various gum leaves and golden wattle were often enclosed with letters to me on service, as reminders of things they loved at home. There comes to mind the story that the arrival of one such mail caused an offensive to occur in France, with the same dried gum leaves stirring some men from the bush to burn some, to enjoy the smell of burning gum trees. One became so excited with memories, that he discharged his rifle in glee, unfortunately Fritz was not to know that and some replied with rifle fire which induced machine guns to join in and so it spread until artillery of both sides were engaged.”

Alban Pierce – Extract from a personal letter

‘Wattle Day and wattle blossom took on a new emphasis during World War I. Light-hearted celebrations and carefree gatherings were replaced by serious fundraising and a depth of patriotism never before experienced among Australians.

The New South Wales Wattle League put all its energies into helping the war effort. Together with the Red Cross and Patriotic Fund, they combined forces to raise as much money as possible by selling sprigs of wattle on the streets of Sydney. Depots were established in various parts of the city to receive wattle sent by country supporters.’

[Source:  http://wattleday.com/greatwar.php ]


National Wattle Day – why do we celebrate?

  • ‘Wattle is our national floral emblem. It is a symbol that comes directly from our land;
  • ‘Wattle is Australian and rerpesents us all. Unlike other national days, National Wattle Day excludes no one;
  • ‘Like our people, wattle has great diversity (with nearly 1.000 species) and resilience;
  • ‘Wattle welcomes in the spring and is among the first plants to regenarate after fire, reminding us of the importance of renewal as it paints our national colours across our land; and
  • ‘Wattle is a unifying symbol for all Australians. There is no other symbol that says so much about us and our land, Australia.
  • ‘Wattle is a symbol of Australia and Australians.

So join the celebration of National Wattle Day – 1 September 2010 in this, the centennial year.

Terry Fewtrell
President
Wattle Day Association

2010

[Source:  ^http://www.wattleday.asn.au/]


Victorian Bushfires 2009

‘This is the message of National Wattle Day. Wattles are usually the first pioneer plants to rise from the ashes of bushfires, using the extra nutrients to support their growth. They then provide protection for other seedlings growing underneath in a natural succession of the bush.’

‘This year we suffered the tragedy of the worst bushfires experienced in our land. Many Victorians lost their lives, their property, everything they owned. Australians all over the continent rallied to their aid, donating money and goods in an unprecedented appeal. The victims are now putting their lives back on track and planning their recovery. This resilience is a characteristic of the Australian way of life. Australians have always shown a determination to succeed and rise above any disasters, showing the spirit that has made us a great nation.’

[Source: http://wattleday.com/ ]
Golden Wattle (Acacia pycnantha Benth.)
©Mornington Peninsula Youth Enterprises
http://www.mpye.org.au/plants.htm

National Wattle Day – ‘It’s an honour’


Further Information:

Australian Government http://www.itsanhonour.gov.au/symbols/flora.cfm
 
Australians in The Great War 1914-1918 http://wattleday.com/greatwar.php
Wattle Day http://www.worldwidewattle.com/infogallery/symbolic/wattleday.php
Proclamation http://www.anbg.gov.au/emblems/wattle.day.gaz.html
Wattle Day Association http://www.wattleday.asn.au/about-wattle-day-1
Australian National Botanic Gardens http://www.anbg.gov.au/emblems/aust.emblem.html
Australia’s Wattle Day http://www.aph.gov.au/library/pubs/cib/1995-96/96cib1.htm
Nationalising Nature: Wattle Days in Australia http://www.api-network.com/jas/pdf/libby_robin.pdf
Wattle Day Research http://wattleday.com/research.php
Wattle Days from Adam Lindsay Gordon to Ginger Mick http://www.nla.gov.au/pub/nlanews/2007/aug07/story-1.pdf
Wattle Nationalism http://www.nla.gov.au/pub/nlanews/2008/jan08/story-1.pdf
National Symbols – Australia’s national floral emblem and national colours www.australiaday.org.au/toolkit/page173.asp
The Genus Acacia http://www.anbg.gov.au/acacia/index.html
Article: Introduction to Acacia http://plantnet.rbgsyd.nsw.gov.au/WattleWeb/intro.php
Article: The name Acacia retained for Australian species http://www.anbg.gov.au/cpbr/taxonomy/acacia-conserved-2004.html
The Acacia Page Association of Societies for Growing Australian Plants (ASGAP) http://asgap.org.au/acacia.html
World Wide Wattle – conservation, utilization and enjoyment of Australian Acacia species (Wattles) http://www.worldwidewattle.com/
Traditional uses of Australian acacias http://www.worldwidewattle.com/infogallery/utilisation/aboriginal.php
Article: If You Start Sneezing don’t Blame the Acacias http://asgap.org.au/APOL2007/jan07-s3.html
Aussie-Info http://www.aussie-info.com/identity/flora/wattle.php

© The Habitat Advocate    Public Domain


World’s Most Endangered Trees

Saturday, August 28th, 2010

by Editor 20100828.

Sherwood Forest

‘Major Oak’


‘Yes, that Sherwood Forest. What was once a thick and dark mass of trees covering 100,000 acres (~20km x 20km) is now a spartan450 acres. Intense harvesting of the forest’s massive, ancient oaks for several centuries is the cause of the deforestation of this legendary woodland. Outcrops of Sherwood’s trees exist beyond the 450 acres but are not dense enough to be considered intact forest.’

[Source:  WebEcoist.com   ^http://webecoist.com/2008/09/13/20-unusual-threatened-forests-around-the-world/]

Canada’s Red Mulberry – at risk of extinction

The Red mulberry (Morus rubra) is one of Canada’s most endangered tree species and is only found in the Carolinian forest zone of southern Ontario. Red mulberry is typically an understorey species found in moist, forested habitats, including floodplains, bottomlands, sand pits and slopes. Because of its declining numbers (there are less than 200 red mulberry trees remaining in Canada) and because of the presence of several threats to its existence, the Committee on the Status of Endangered Wildlife in Canada (COSEWIC) has designated the red mulberry as “endangered” in Canada.’


[Source: Natural Resources Canada,  ^http://cfs.nrcan.gc.ca/factsheets/mulberry ]

Florida’s  Torreya Tree – most at risk on the planet!

Florida torreya (Torreya taxifolia)
©Calvin & Judy Seaman
^http://www.dfr.state.nc.us/urban/tree_detail.asp?Tree_ID=210


According to the website Hubpages.com‘ the tree the Florida Torreya (Torreya taxifolia) is the most endangered tree species in the wild in the world, and the other most at risk endangered trees around the world are:

  • African Ash
  • African cherry
  • African mahogany
  • African Teak
  • Afzella
  • Aja
  • Ajo
  • Alcerce
  • Almaciga
  • Argarwood
  • Bintangor
  • Brazilian cherry
  • Brazilian rosewood a.k.a.Dalbergia Nigra, Jacaranda da Bahia
  • Bleedwood tree
  • Ceylon satinwood
  • Egba
  • Guatemalan fir
  • Honduras mahogany
  • Ipe
  • Kauri
  • King William Pine
  • Lauan
  • Meranti
  • Molave
  • New Guinea walnut
  • Nayotah
  • Parana pine
  • Parlatorei
  • Pau rosa a.ka. Pau Brasil
  • Pencil cedar
  • Ramin
  • Red sandalwood
  • Rosewood
  • Sajo
  • Spanish cedar
  • Teak
  • Utile
  • Walnut
  • West Indian Satinwood
  • [Source:  ^http://hubpages.com/hub/Endangered-Trees ]

    UNEP Official List of Endangered Tree Species:

    According to the United Nations Environment Programme [UNEP], the world’s officially top twelve species of endangered trees are:

    African Blackwood, which is also known as Mpingo in Swahili is considered to be the national tree of Tanzania, despite the fact that it is native to 26 African countries, ranging from northern Ethiopia, to the south in Angola, also spreading from Senegal across to Tanzania.

    Mpingo not only improves soil fertility, but is also good at maintaining soil stability. Its leaves offer feed for migrating herbivores and for domestic livestock. The mature African Blackwood trees are capable of surviving fires that destroy other vegetation in grasslands. The dark heartwood of Mpingo, is one of the most economically valuable timbers in the world.

    Bois dentelle is a beautiful tree, endemic to the high cloud forest of Mauritius. Despite the fact that it has no commercial value, only two individuals are left. The most remarkable thing about the species are the flowers – sprays of white bell flowers with fine lacy petals that cover the tree in summer (January -March).

    The Clanwilliam cedar is a species endemic to the Cederberg Mountains in the Western Cape Province of South Africa. A majestic tree of 6-18 meters in height, the Clanwilliam cedar is a rot-resistant, fragrant and visually beautiful timber that was extensively exploited for building, furniture and later on telegraph poles by European settlers in the eighteenth century.

    The Dragon Tree is found on the Canary Islands, Cape Verde Islands, Madeira and Morocco. The Guanche people of the Canary Islands used the sap for mummification purposes. In Ancient Rome, Sangre de Drago (Dragon Tree) was used as a colorant and across Europe it has been used as a varnish for iron tools.

    According to the Greek myth, “The Eleventh Labor of Hercules: The Apples of the Hespérides”, the hundred-headed dragon, Landon, who was said to have been the guardian of the Garden of the Hespérides, was killed by either Hercules or Atlas in order to fulfill Hercules’ task to bring back three golden apples from the garden. As told in the myth, the trees known as ‘Dragon Trees’ sprung from Landon’s red blood, which flowed out upon the land.

    The species is classified as being “Endangered” by Cape Verde, while it is identified as being extinct in the wild on Brava and Santiago where only planted specimens exist today.


    The Honduras rosewood is found in Belize in Central America and produces timber, which is extremely valued on the world market because of its use in musical instrument production.

    Since the Honduras Rosewood supplies hard, heavy, durable and very resonant timber, when struck, it gives off a clear, loud note and making it itself most highly valued in the production of orchestral xylophones and claves. It is also used to make thin covering for fine furniture and cabinets, , knife handles etc.


    The Loulu is a palm endemic to the northernmost of the Hawaiian Islands chain with the most variety of plant species of any island in Hawaii. There are fewer than 300 individuals of the Loulu left, because of limited regeneration caused by seed predation by rats and pigs as well as competing plants.


    The Monkey Puzzle is the National Tree of Chile. Nevertheless, there is at least of these trees in every botanical garden in Europe. Its local name is Pehuén and its existence has great historical and social importance to the people living in that area known as the Pehuenche, which means “people of Pehuén”. The seeds of the tree shape an important part of their diet.

    The Monkey puzzle is also valued for its unique and natural beauty, which makes it an emblem of a national parks and provinces in both Chile and Argentina. The timber found from the Pehuén has a high mechanical resistance and moderate resistance to fungal decay, hence for its being used for beams in buildings, bridges, roofs, furniture, boat structures, thin covering etc. Monkey puzzle forests have been fast destroyed and degraded due to logging, fire and grazing.


    Nubian Dragon Tree is found in Djibouti, Saudi Arabia, Somalia, Sudan, and Uganda and was once a widespread and abundant species.

    It is one of the few species that can survive wide periods of drought in all parts of its scope, hence making it an important part of the desert ecosystem. The mature fruits of the Nubian Dragon tree are eaten and its sap and fruit may also have medicinal properties.


    Pau brasil is the national tree of Brazil, making it have strong cultural links to Brazil’s social and economic history. The species is known for the dye extract taken from the heartwood, for which it has been exploited since 1501. Presently, the dye extract and its bark are used locally for medicinal purposes. Research is being carried out to find out whether the bark of this tree can be used as a cure for cancer.

    Pau brasil wood is hard and compact, which is almost indestructible and was traditionally used to make hunting tools; commercially, it was harvested for use as a construction timber and in craftwork. It is also highly valued by musical instrument makers and still being exported for the production of bows for stringed instruments.

    The various uses acquired from the Pau Brasil have made it target to extensive collection and export of the dyewood, resulting in the loss of large areas of forest and the enslavement of local people and later on the demand for its timber by bow manufacturers has contributed to a great loss.


    Quercus hintonii, also known as Encino of Hinton (Hinton’s Oak), is endemic to Mexico. Some of the wood’s uses range from locally made tool handles, to beams and fencing poles, and primarily for firewood. Traditionally the wood is used to bake bread known as “las finas”, which the distinctive taste is brought on by the smoke.

    The species has also been highly affected by grazing, which prevents regeneration as well as the coming up of agriculture, coffee plantation and road construction have all contributed to the decline in the Quercus hintonii populations.

    “Hinton’s Oak, Quercus hintonii, is listed as Critically Endangered on the IUCN’s Red List of Threatened Species™. It is found in sub-montane to montane dry forest in Mexico. Hinton’s Oak has a restricted habitat and is thought to have strict altitudinal requirements. It has become threatened in recent years due to the serious destruction and reduction in size of its habitat.”

    [Source:  IUCN, ^http://www.iucnredlist.org/sotdfiles/quercus-hintonii.pdf


    St Helena gumwood was selected as St. Helena’s national tree in 1977. The endemic floras of St Helena are not only of great biogeographical significance, but they are also home for equally rare and unusual animal species. The St. Helena gumwood is one of the fourteen most globally endangered and endemic tree species in St Helena. It is threatened by human presence and their use of the timber for firewood and building.


    The Wollemi pine belongs to the ancient Araucariaceae species, thought to be over 200 million years old. Until 1994, the Wollemi pine was believed to have become extinct about 2 million years ago, but it was rediscovered in a gorge 150 km north-west of Sydney, Australia. There are less than 100 mature trees in the wild, making it one of the rarest species in the world. Because of this rarity, the Wollemi attracts a lot of tourism, which threatens its existence because of the therefore threatened by tourism, for it may be disturbed by human activities, also exposing it to seeds being trampled, compaction of the soil, the introduction of weeds and an increase in the possibility of fires.

    Wollemi Pine (Wollemia nobilis),
    © J.Plaza RBG Sydney

    [Source:  UNEP, ^http://www.unep.org/documents.multilingual/default.asp?documentid=445&articleid=4845&l=en, accessed 28-Aug-10.]


    IUCN categorisation of tree species at risk of extinction:

    The International  Union for Conservation of Nature [^IUCN] ‘criterion A’ requires that a subject tree species has a small wild population – less than 5000 individual specimens exist in the wild on Earth.

    • A tree species will be determined to be Critically Endangered (of extinction) if there is expected to be at least 80 %  decline in 10 years or 3 generations
    • A tree species will be determined to be Endangered (of extinction) if there is expected to beat least 50 % decline in 10 years or 3 generations (Endangered)
    • A tree species will be determined to be Vulnerable (of extinction) if there is expected to beat least 20 % decline in 10 years or 3 generations.

    [Source:  ^http://www.cites.org/eng/prog/criteria/1st_meeting/trees.shtml]


    Further Information:

    [1]  Global Trees Campaign  ^ http://www.globaltrees.org/

    [2]  Fauna & Flora International ^http://www.fauna-flora.org/

    [3]  Botanical Gardens Conservation International ^http://www.bgci.org/

    [4]  Guide to Endangered Trees ^http://ran.org/content/guide-endangered-trees-0

    [5]  Trees for Life  ^http://www.treesforlife.org.uk/index.html

    [6]  Tree species evaluation using the new CITES* listing criteria ^http://www.cites.org/eng/prog/criteria/1st_meeting/trees.shtml

    [7] WebEcoist ^http://webecoist.com/2008/09/13/20-unusual-threatened-forests-around-the-world/

    [8]  BBC article ‘Sherwood Forest ‘is under threat‘,5-Oct-07, ^http://news.bbc.co.uk/2/hi/uk_news/england/nottinghamshire/7029493.stm

    [9]  1000 year old Major Oak, Sherwood Forest, Nottinghamshire, England  ^http://www.eyemead.com/majoroak.htm

    [10]  The Tree Council (UK),  ^http://www.treecouncil.org.uk/

    [11] The Tree Council (Ireland), ^http://www.treecouncil.ie/

    [12]  Treasures of the Plant Kingdom, ^http://gardenwebs.net/plant.jewels.htm

    [13] WollemiPine.com  ^http://www.wollemipine.com/index.php

    [14] Kew Gardens – Science & Conservation (England),  ^http://www.kew.org/science-conservation/index.htm

    *CITES stands for the ‘Convention on International Trade and Endangered Species of Wild Fauna and Flora


    Did You Know that?

    • ‘An area of a rainforest the size of a football field is being destroyed each second.’

    • ‘The forests of Central Africa are home to more than 8,000 different species of plants.’

    • ‘More than 5,000 things are made from trees such as houses, furniture, pencils, utensils, fences, books, newspaper, movie tickets even clothing and toothpaste.’

    • ‘Three-quarters of the world’s people rely on wood as their main source of energy.’

    • ‘In Ethiopia, between 100,000 and 200,000 hectares of forest are cut down every year. Still, at least 200 million people lack enough wood to cook their food properly.’

    • ‘Destruction of forests creates numerous environmental catastrophes, including altering local rainfall patterns, accelerating soil erosion, causing the flooding of rivers, and threatening millions of species of plants, animals and insects with extinction.’

    • ‘Tropical forests cover 23 per cent of the Earth’s land surface, but they are disappearing at a rate of 4.6 million hectares a year. Asia leads losses with 2.2 million hectares a year, Latin America and the Caribbean together lose 1.9 million and Africa loses 470,000 hectares of rain forest every year.’

    • ‘About 6.1 million hectares of moist deciduous forest disappear every year, of which the largest regional share is in Latin America and the Caribbean, with 3.2 million hectares lost.’

    • ‘More than 1.8 million hectares of dry deciduous forest disappear every year, 40 per cent of which is lost in the Sudan, Paraguay, Brazil and India.’

    • ‘Annual losses of very dry forest total some 341,000 hectares. The Sudan loses 81,000 hectares of this type of forest every year, followed closely by Botswana, with 58,000 hectares.’

    • ‘Global annual deforestation for desert forest stands at an estimated 82,000 hectares, 60 per cent of which is lost in Mexico and Pakistan.’

    • ‘Hills and mountains lose about 2.5 million hectares of forest annually, 640,000 of which are lost in Brazil, 370,000 in Mexico, and 150,000 hectares in Indonesia.’

    [Source: ^UNEP website ]


    El Árbol del Tule

    (Spanish for “the Tule Tree”) is a tree located in the church grounds in the town center of Santa María del Tule in the Mexican state of Oaxaca.  It has the stoutest trunk of any tree in the world. In 2001 it was placed on a UNESCO tentative list of World Heritage Sites.  In 2005, its trunk had a circumference of 36.2 m (119 ft), equating to a diameter of 11.62 m (38.1 ft).      [Source: http://en.wikipedia.org/wiki/Árbol_del_Tule ]

    © The Habitat Advocate    Public Domain

    VicForests’ policy of extinction

    Thursday, August 26th, 2010

    by Editor 20100826.

    East Gippsland, Victoria April 2009:

    The senseless killing of a 500+ year old rare surviving Eucalyptus regnans
    by VicForest contractors in April 2009.
    ( Photo courtesy of Environment East Gippsland)
     

    Logging halted at iconic Bungywarr Creek (East Gippsland, Victoria, Australia)

    29 April, 2009

    ‘Today independent forests conservationists are protecting ancient forests from logging in far East Gippsland.

    “Two protestors are ‘flying’ a platform located thirty metres up in the tree canopy”, says spokesperson for the group, Ms Lauren Caulfield. “This platform is cabled off to four logging machines, immobilizing them.”

    The tree-top protestors are supported by twenty-five forests conservationists on the site.

    Bungywarr Creek was first blockaded in 1994, and has remained a contentious logging site ever since.

    “Bungywarr Creek forest was identified as iconic almost two decades ago. The old-growth that remains at Bungywarr should be included in the Brumby government’s next round of forest protection”, said Ms Caulfield.

    Earlier this month it was revealed that forests like the magnificent stands along Bungywarr Creek are sold to export woodchipping companies for less than the price of a Mars bar – a mere $2.50 per tonne.

    “Selling our valuable and carbon-rich native forests for the price of a fast food snack is not making the best financial returns to Victorians”, said Ms Caulfield.

    “For VicForests to continue to woodchip the remaining 8% of Victoria’s old-growth forests under Mr Brumby’s watch is a disgrace. Victorians expect and deserve management of our forests for a truly sustainable future.”

    “Protecting nature is one of the most important ways to fight climate change”, continued Ms Caulfield. “The forest at Bungywarr Creek will do a better job fighting climate change if it is left intact and able to suck carbon dioxide out of the atmosphere.”

    “While the Brumby government dithers on delivering the ageing 2006 old-growth forest promise, logging at Bungywarr Creek is making climate change worse”, concluded Ms Caulfield.”

    [Media Release courtesy of Environment East Gippsland]
     

    © The Habitat Advocate    Public Domain

    The Planet’s Critically Endangered Birds

    Thursday, August 26th, 2010

    by Editor 20100826.

    Critically Endangered Birds: A Global Audit’ is a summary review by ^Birdlife International as a product of its BirdLife Preventing Extinctions Programme.  It presents the science underpinning the programme and the actions needed by other organisations, agencies and governments to complement it.

    It reports the state of the world’s Critically Endangered birds as they were in 2008, highlighting the pressures they face, and the actions needed to prevent their extinction.  The report is drawn from material developed for State of the World’s Birds, a broader report which is available for download and as an extensive searchable database at ^www.birdlife.org/sowb

    The ‘Critically Endangered Birds: A Global Audit’ report (PDF, 3.36 MB) is available by clicking the following link :

    ^Critically_Endangered_Birds_global_audit_(Birdlife_Intl_2008)


    © The Habitat Advocate    Public Domain

    Bushfire Reform 01: Total Fire Cost

    Friday, August 20th, 2010

    by Editor 20100820.

    Following the devastating Grose Valley bushfires of November 2006 in New South Wales (Australia), which burnt out 14,070 hectares of high conservation bushland in and around the Greater Blue Mountains World Heritage Area, the editor (a nearby resident and witness) wrote to the head of the NSW Rural Fire Service.

    The letter raised serious concerns about bushfire management and offerred constructive recommendations and a detailed operational reform initiative.  The letter was not responded to by the Rural Fire Service.

    [Read below]

    Aftermath of the Grose Valley Bushfires, Blue Mountains, NSW (Australia)
    looking from Govett’s Leap, Blackheath.
    [Photo taken 9-Dec-2006]


    The Habitat Advocate

    PO Box 21

    KATOOMBA NSW 2780

    Wednesday, 9th January 2007

    Mr Keith Harrap

    Assistant Commissioner

    NSW Rural Fire Service

    15 Carter Street

    HOMEBUSH NSW 2127

    Dear Mr Harrap,

    Your Ref:   M07/0515

    RE: FOI Request for Operational Reports & Costs of the Grose Fire

    Thank you for your reply letter of 24-Dec-07.  I appreciate the efforts of your staff to search and to try to provide this information that I have requested about the operational reports and costs directly associated with the Grose Fire of November 2006.  I am particularly grateful for the co-operative communication provided by Justin Walsh at NSW Rural Fire Service (RFS) headquarters.

    I have some questions about the information provided in respect to the RFS recording of events and costs associated with this major fire.  I wish to also offer some observations and make recommendations that I will appreciate you taking on board by way of ongoing quality improvements to fire management policy and practices.  In this regard, I have had some brief communication with the local Superintendent District Manager of the RFS in the district where I live (the Blue Mountains), Mal Cronstedt.

    Mal Cronstedt as you will be aware, was the Incident Controller of the Grose Fire.  As courtesy I shall send him a copy of this letter as well as the information you have provided me.  I will also appreciate you passing on a copy of this letter to the NSW RFS Commissioner, Mr Shane Fitzsimmons and advise that I will also welcome his feedback.

    Fire Incident Recording

    I am surprised by your reply that the RFS does not have any record or minutes of the operational meeting immediately following the Grose Fire.  The reported inter-agency review that took place at Katoomba on 19th December 2006 some three weeks after the fire would have included critical operational information about the Grose Fire. The accurate hands-on operational feedback from fire fighters would have proved invaluable in preparing the formal Section 44 Incident Controller’s Report into this fire.  Such operational information, feedback and assessment would be invaluable in providing increased understanding of the fire incident and fire behaviour, of resource utilisation and of management handling and decision making during the fire.

    This would support fire investigation efforts and facilitate analysis of the fire and of fire fighting performance and effectiveness.  It would be a valuable addition to the wealth of strategic and operational fire knowledge to the local fire command to help them take remedial actions to improve fire management standards and resourcing.

    However, without any operation records of this major fire incident such benefits have been lost.

    I have asked Justin Walsh at RFS headquarters to also find out if any reports or meeting minutes exist by either Fire Captains at Katoomba or Lithgow from where the fire fighting of the Grose Fire was jointly controlled.  If such information exists then I shall be applying for an additional Freedom of Information request for this.

    Given the considerable monetary cost of this fire, the extensive resources required to combat it and bring it under control, the wide media attention it attracted and the public outcry as a result of the damage to the Blue Gum Forest, it would seem inconceivable that no records, field notes or daily records exist about the fire’s progress and of decisions and actions taken by fire management.

    If so, this suggests a serious disconnect between executing fire suppression operations and monitoring those operations.  This surely would undermine performance management planning and review systems within the RFS.  It sends a message to the community that the RFS is not accountable.

    As you will be aware, under the RFS Corporate Plan 2007-2009, a key value includes ‘continuous improvement’ which it applies on page 14 to being “we pro-actively seek, develop and implement benchmarks, to measure, monitor and improve our performance.”

    RFS Key Strategy Programme 1.1.5 under this plan reads:

    “Maintain an accurate system for the recording of all fire and emergency incidents using the Fire Incident Reporting System (FIRS) by reporting all incidents to the Operations Customer Support Centre.”

    RFS Key Strategy Programme 1.1.33 under this plan reads:

    “Continuously improve the effectiveness and efficiency of the Service’s business and tactical planning by reviewing, maintaining and improving the Service Delivery Model (SDM).”


    I have concerns that this plan is not transferring into practice.

    Recommendation:


    Last month I outlined to Mal Cronstedt a recommended reform initiative ‘Compulsory Fire Event Logging’.  This reform initiative proposes to standardise and make compulsory a Bushfire Event Log for every registered fire in New South Wales.  This would seek to capture all quantitative and qualitative information about a fire. The purpose of a Fire Event Log would be to capture and consolidate all information associated with combating a fire into one document for operational analysis and future reference use.

    I look forward to Mal’s feedback on this recommended reform.

    Total Fire Cost

    The expenditure summary that you have provided seems to be an internal RFS accounting report limited to the direct recorded outlays of the RFS associated with the Grose Fire.

    However, my Freedom of Information request is for the total cost of the Grose Fire – the ‘Total Fire Cost’. By this I am referring to all expenditures and costs incurred by the RFS and all associated organisations involved directly and indirectly in fighting this fire, including asset loss valuations.  The direct and indirect costs that I expect can be attributed to the fire, would include:

    • Direct and indirect operating costs incurred by the RFS from the time of first responding to the fire through to completing mopping up operations after the fire was extinguished
    • Direct and indirect operating costs incurred by all fire fighting authorities fighting the fire including NSW Rural Fire Service (RFS) – both local and Inter-District, NSW Fire Brigades (NSWFB), Department of Environment & Conservation (NSW) – (NSW National Parks and Wildlife Service (NPWS)).
    • Direct costs incurred by organisations associated with fighting the fire such as the many interstate support agencies seconded to fight the fire, including their associated transport and accommodation costs, plus the costs of other support organisations which can directly attribute costs specifically to this fire.   Support Agencies listed in the Section 44 Report section 4.2 include the following:
    • Any direct operating costs of the fire not paid for by the RFS due to funding, subsidies or rebates provided by government agencies outside the RFS.
    • Direct expenses of related injury and accident claims of personnel directly involved in fighting the fire, including the cost of WorkCover claims, related payouts and lost time at work.
    • Economic loss valuations of property, plant and equipment damaged as a direct result of the fire.  This includes those of owners of land and infrastructure such as DECC, Blue Mountains City Council, RailCorp, Sydney Catchment Authority, Integral Energy, Telstra, the NSW Roads and Traffic Authority and private land owners, including insurance claims.
      • Ambulance Service of New South Wales
      • Blue Mountains City Council (BMCC)
      • Department of Defence, Royal Australian Air Force (RAAF)
      • Integral Energy
      • NSW Department of Community Services
      • NSW Department of Land and Water Conservation
      • NSW Department of Primary Industries
      • NSW Health
      • NSW Police Force
      • NSW State Emergency Service (SES)
      • Roads and Traffic Authority, NSW (RTA)
      • Rail Corporation New South Wales (RaiICorp)
      • Salvation Army
      • St Johns Ambulance of Australia
      • Sydney Catchment Authority (SCA)
      • Sydney Water
      • Telstra Corporation Limited

    This list is not exhaustive.

    Importantly, here I am not seeking to obtain the broader social and environmental costs, which though relevant, would understandably be more difficult to estimate and obtain.  Instead, I am merely seeking those accounting costs that can be reasonably and justifiably attributed to this fire.  Such costs must be recorded respectively by each organisation as part of Australian financial accounting practices.

    Does the RFS have access to these costs?  Does the RFS maintain a database that captures all direct and indirect costs of each major bushfire in NSW?  If not, does the RFS have any plans to start capturing Total Fire Costs of major fire or indeed to capture the Total Fire Costs of each registered fire incident during each financial year?

    Recommendation:

    I propose that the RFS should capture the Total Fire Costs for each major fire and, to be comprehensive, for all registered fire incidents to which the RFS responds.  The expertise for this task may well require the assistance of an outside audit firm.

    However, the benefit of this to the RFS and to the community will be considerable in highlighting the Total Fire Costs of fighting fires in New South Wales, which I argue we still don’t know with any reliably accuracy.  I expect that for the Grose Fire for instance, the Total Fire Cost will be a considerably larger figure than the internally recorded accounting records of the RFS of $6.1 million.

    Such record keeping will serve to greatly assist the effort of the RFS to attract increased funding to enable it to better:

    1. mitigate the risk of bushfires
    2. resource itself to better detect ignitions
    3. resource itself to better suppress bushfires.

    I understand that between 2003 and 2007 the Bushfire Co-operative Research Centre (Bushfire- CRC) with RMIT University completed a research project, which involved researching the ‘true costs of bushfires’.  It would be useful to seek the reports from this project.

    RFS Reporting of Fire Incidents

    Please advise RFS policy and practice guidelines for recording major fire incidents?  [Read recommended policy initiative below]

    Recommendation:

    As an RFS policy, that for each major fire incident declared under Section 44 of the Rural Fire Act 1997, I recommend that both an Incident Controllers Report together with the Total Fire Costs of Fire be provided by the RFS to the Minister for Emergency Services.

    I will welcome your feedback and the opportunity to participate in reforms to fire management across NSW.

    Yours sincerely,

    [the Editor]

    CC:                   Mal Cronstedt, Superintendent, District Manager, Blue Mountains


    Rural Fire Management Reform

    Recommended Reform Initiative #01

    Compulsory Fire Event Logging

    Table of Contents


    1.    Purpose of Reform Initiative

    2.    Recommended Policy

    3.    Recommended Procedures

    4.    Justifications for Reform Initiative

    5.    Benefits of Reform Initiative


    1.     Purpose of Reform Initiative

    This reform initiative proposes to standardise and make compulsory a Bushfire Event Log for every registered fire in New South Wales.

    The purpose of a Fire Event Log is to capture and consolidate all information associated with combating a fire into one document for operational and reference use.

    Typical information about a fire is to be sourced from fire management decision-making, deployment instructions, radio communications from fire-fighting crews, observations by airborne crews, current weather statistics from the Bureau of Meteorology and relevant information received from other emergency services (NSWFB, Police, Ambulance, SES, etc) associated with a subject fire.


    2.     Recommended Policy

    The Fire Control Centre of each Rural Fire District in New South Wales must establish and maintain a separate Fire Event Log of each registered fire occurring, either wholly or partially, within its Rural Fire District.

    A minimum Australian standard of vital fire information necessary for a Fire Event Log must be established and approved by the NSW Rural Fire Service Commissioner.  This standard must be reviewed annually ahead of each peak fire risk season.

    A suitable training programme in Fire Event Log Procedures must be established to enable suitable fire personnel to be trained in order to competently maintain a Fire Event Log to the minimum Australian standard.

    This policy should be integrated into the RURAL FIRE SERVICE Standard Operating Procedures once a process of consultation with all relevant personnel has been extensively undertaken across the entire breadth of the organisation.

    Once approved, a Fire Event Log Policy and Procedures should be gazetted into the Rural Fires Act (NSW), 1997 and considered similarly for each fire authority in each Australian State.


    3.     Recommended Procedures

    • The Fire Control Centre of each Rural Fire District across New South Wales must establish a new and separate Fire Event Log upon becoming first aware of any fire within its fire district.
    • A Fire Event Log must be maintained continuously throughout the duration of a fire within a Fire District until such time as the responsible Fire Control Officer (or higher RURAL FIRE SERVICE command) declares the fire extinguished within that district.
    • A Fire Event Log must be recorded using the RURAL FIRE SERVICE central computer system, with appropriate daily data back ups generated at the end of each day.
    • The Fire Control Officer for a given Rural Fire District is ultimate responsibile and accountabile for establishing and maintaining an accurate and thorough Fire Event Log for each fire in its district.  A Fire Control Officer may only delegate the task of maintaining a Fire Event Log to a qualified fire fighter holding a current endorsement in Fire Event Log Procedures.
    • The Fire Control Officer of each Rural Fire District must endeavour to capture all information about a fire in a separate Bushfire Event Log for each fire (where possible) including, but not limited to
    1. The designated name of the subject fire
    2. Date & time of the ignition
    3. Location of the ignition
    4. Cause of the ignition
    5. GIS digital map updating of the fire spread, likely path and key data
    6. Details of the initial reporting of the fire outbreak/detection details
    7. Lapse time to initial response & details of initial response action
    8. Location of fire(s) & fire behaviour updates at 15 minute intervals
    9. Local and forecast weather statistics relevant to the fire
    10. Interstate agencies seconded
    11. Daily updates on Total Area Burnt
    12. Daily updates on any lives Lost
    13. Daily updates on property lost, including number of dwellings
    14. Daily updates on area of private property & farmland burnt
    15. Daily updates on areas of mapped high conservation areas burnt
    16. Daily updates on the number of fire-fighters involved
    17. Daily updates on the number of aircraft involved
    18. Daily synopsis on the fire(s) status
    19. Executive decisions and actions taken, including incident declaration
    20. Critical issues
    21. Key operational threats & risks
    22. Fire resource needs and shortfalls
    23. Contact details and correspondence with assigned fire investigation
    24. Total duration of fire activity once extinguished
    25. Injury Summary Report
    26. Resource Usage Summary Report by contribution agency
    27. Register of Support Agency Involvement
    • When a fire takes the form of combined fires or multiple fire fronts within reasonable proximity in a geographic area, the responsible Fire Control Officer may order that a single Fire Event Log be maintained for the combined fires/multiple fire front.
    • Regular communication must be maintained between the Fire Control Centre and field brigades fighting a fire to facilitate logging fire activity to a minimum standard that allows communications at a minimum interval of 15 minutes.
    • Any communications failures or difficulties between firefighting crews (ground and airborne) and Fire Control, or any problems experienced  in maintaining a minimum 15 minute communications frequency, must be immediately reported by the Fire Control Officer, or in the case of a major fire incident, to the Incident Controller.
    • A Fire Event Log is to be deemed the official single register of a fire event, a core operational document and a legal document admissible in a court of law.
    • As an internal document, a Fire Event Log is not automatically available for public access.  The RURAL FIRE SERVICE Commissioner may at his/her discretion allow public access to such a document via a Freedom of Information Request from a member of the public.
    • The integrity and security of a Fire Event Log is paramount and is the ultimate responsibility of the Fire Control Officer assigned to a given fire.  A digital copy of Fire Event Log must be provided by a Rural Fire District branch to RURAL FIRE SERVICE Headquarters within 7 days of the fire being declared extinguished.  A secure and accessible database of Fire Event Logs is to be maintained by both the respective  Rural Fire District branch and for all fires across NSW by RURAL FIRE SERVICE Headquarters.

    4.     Justifications for Reform Initiative

    • While it is acknowledged that the author is not a member of the Rural Fire Service and so not privy to Rural Fire Service policy and procedures for recording bushfire operations, the lack of operational detail provided the Section 44 Incident Controllers Report for the Nov-06 Grose bushfire and the absence of minutes from the subsequent Inter-Agency review on 19-Dec-06, highlight shortcomings in record keeping of fire operations.
    • Perhaps much of the information reported of bushfire events is obtained from personal recollection of events from individual line personnel a considerable time after the event.   For instance, the Section 44 Report into the Grose bushfire (14-Nov-06 to 3-Dec-06) is dated 8-Feb-07, two months later.  There are obvious problems relying upon recollecting detailed events, the precise time and order of those events, the changing fire behaviour, the decisions made and actions taken and the changing conditions at the time.  The absence of a factual minute by minute event log makes it difficult to be accurate and comprehensive in reporting major bushfire incidents. In the event of a major fire, maintaining a Fire Event Log will provide a record the performance of the four ICS functions – control, operations, planning and logistics.
    • It may well be that bushfire agencies in each Australian state have their own methods and protocols for recording fire events.  It may also be that different agencies and indeed different regional branches have their own different ways of recording bushfire event data. There is likely no universal consistent standard across Australia of recording bushfire events as they occur.  Some records may be better than others.  There is a need to have a consistently high standard of record keeping for bushfire events across Australia.
    • Recent coronial inquests in Australia into bushfire deaths (Canberra Bushfire Jan 2003, Eyre Peninsula Fire Jan 2005), highlight the need for fire authorities need to have accurate records of bushfire events so that they are better able to defend their actions in court.

    5.     Benefits of Reform Initiative

    • The benefits of establishing and maintaining a Bushfire Event Log is to better enable bushfire management to achieve an accurate and comprehensive record of a fire – the events, decisions and actions and outcomes associated with each fire event.   All relevant operational data associated with a fire will be recorded in one convenient document.
    • A Bushfire Event Log will provide a reliable source document for preparing a fire incident report.  This will avoid the often difficult task of having to recall events, the order of those events, decisions made along with the fire behaviour at the time, long after a fire sometimes days or weeks later when memories have faded.
    • Recent reports and inquests have highlighted failures in fire-fighting communications, which arguably had a role in contributing to operational problems in controlling the spread, severity and impacts of fires.  Compulsorily requiring a Bushfire Event Log will require regular communication between fire-fighters and Fire Control.  This requirement will help drive the need to improve the reliability of operational communications during a bushfire event.
    • A Bushfire Event Log will provide a actual live record of the performance of the co-ordination, command and control functions of the ICS, including the operational sequence: Reaction, Reconnaissance, Appreciation, Plan, Issue of Orders and Deployment.   This log will be highly useful at a debriefing session following a fire, allowing operational problems to be better identified.  This will aid the RURAL FIRE SERVICE to increases its knowledge and understanding of rural fire fighting.
    • A Bushfire Event Log will enable bushfire management to be more transparent in reporting its operations, assisting any possible coronial investigations, for operational evaluation and improvement, analysis and to contribute firefighting practice into bushfire research.  By making fire event logging compulsory, regular information must be fed back to central command in order to achieve the minimum reporting standard.  This will drive a higher standard in strategic communications.


    © The Habitat Advocate    Public Domain

    Editor near Blue Drum Waterhole

    Wednesday, August 11th, 2010

    by Editor 20100811.

    Editor at Blue Drum Waterhole along the Kings Tableland Road south toward McMahon’s Lookout, Blue Mountains, NSW,  Australia, 12th November 2004.


    © The Habitat Advocate    Public Domain

    Quoll numbers declining in Tasmania

    Tuesday, August 10th, 2010

    by Editor 20100810.

    The following article appeared on ABC Television in Tasmania (Australia), Friday 16th July 2010.


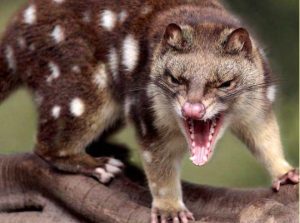
    ‘Scientists are concerned about a decline in eastern quoll numbers in Tasmania.

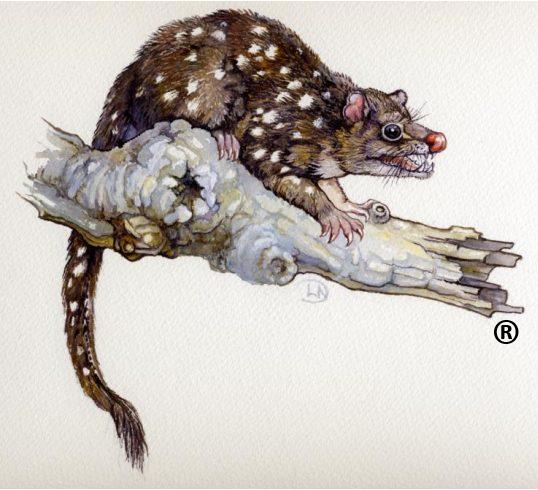
    The eastern quoll is a carnivorous marsupial and is sometimes known as a native cat.

    Scientists predicted quoll numbers would rise as the tasmanian devil population was decimated by the facial tumour disease.

    But spotlighting survey work has shown numbers have fallen by half.

    University of Tasmania honours student, Bronwyn Fancourt, is now doing more detailed survey work but says initial results are concerning.

    We really need to protect these guys because we don’t want to see them end up as another thylacine,” she said.

    Blood samples and measurements will be taken for further research into why the species is in decline.’


    Further reading on the plight of Quolls in Tasmania:

    [The following article was extracted from the Tasmanian Times of 15th May 2010, by Nick Mooney, Richmond (Tasmania), ^http://www.tasmaniantimes.com/index.php/article/cynical-dismissal-of-substantial-material-evidence ].

    Cynical dismissal of substantial material evidence

    Image for Cynical dismissal of substantial material evidence

    ‘An acceptance of unreferenced anecdotes as proof (of eastern quolls being introduced to Bruny in the 1970s) alongside cynical dismissal of substantial material evidence that has passed several reviews (of foxes in Tasmania) sits very poorly with your call to just deal with facts Mr Clarke (letters, Mercury 15th).

    I presume your anecdotal proof is nobody you know remembering eastern quolls to be on Bruny before 1970.

    Maybe they were rare then and simply overlooked or just never officially recorded just like much wildlife there.

    DNA comparisons suggests Bruny Island quolls have been separated from mainland Tasmanian populations for a lot longer than 40 years.

    I remain to be convinced eastern quolls were introduced to Bruny in the 1970s. Radical boom-bust cycles are a natural feature of eastern quoll ecology and the current boom will bust.

    There are no species on Bruny that do not cope with eastern quolls and or spotted-tailed quolls and devils elsewhere in Tasmania so who’s mounting the scare campaign Mr Clarke?

    Eastern quolls are not top predators on Bruny. Masked owls prey on them as can cats and diurnal birds of prey are one reason they are nocturnal. Eastern quolls are extinct on mainland Australia mainly because of foxes and will be amongst the first to go if foxes get fully established here.

    If you look beyond your backyard Mr Clarke you might find you actually have an asset.

    Finally, I have never been head of wildlife management and my views sometimes conflict with those of the department.

    I prefer to put devils on Bruny because its a restoration and not a range extension such as Maria Island, the department’s preference, and something being assessed for years before the Tasmanian Conservation Trust showed interest.’


    Survival fears for quolls

    [This article was extracted from the Hobart Mercury of 16-July 2010, by Charkes Waterhouse, http://www.themercury.com.au/article/2010/07/16/159131_tasmania-news.html ].

    ‘Another native Tasmanian species is under threat, with the population of eastern quolls falling around the state.

    The decline has alarmed experts as the eastern quoll was expected to thrive to fill the void left by falling numbers of disease-ravaged Tasmanian devils.

    The University of Tasmania and the Department of Primary Industries, Parks, Water and Environment will investigate the extent of the falling population.

    DPIPWE threatened species zoologist Clare Hawkins said the study would provide scientific data on the status of the species.

    She said annual spotlighting information suggested the population of the eastern quoll had declined.

    “It does appear quite complicated as at the same time there are areas of the state, such as Bruny Island, where landowners are reporting they have never seen so many eastern quolls,” she said.

    “It may be that in some areas of the state they remain in high numbers, whereas other parts of Tasmania have had declines, or it may be that in some areas they are coming into closer contact with the urban environment making them more observed, which could be masking an overall decline.”

    University of Tasmania zoology honours student Bronwyn Fancourt said a systematic survey would provide scientific information on the wild population, building on information about population changes and showing whether there were areas where increases or decreases had occurred.

    “Tasmania is the last stronghold for the eastern quoll as it is now presumed extinct on mainland Australia, which highlights the importance of having scientific data on what the population is doing,” Ms Fancourt said.

    She said the survey was taking place through a trap-and-release program at various sites.

    Information from this program and any other data collected could help an understanding of possible contributory factors if the quolls were in decline.


    Foxes, quolls, devils and 1080

    [This article is extracted from the Tasmanian Times, 24-Nov-2006, by wildlife biologist Nick Mooney,^ http://tasmaniantimes.com/index.php?/article/nick2/].

    Assessing the Risks

    When assessing the risks of 1080 fox baiting to individuals or populations of any particular species a number of things should be taken into account, including:

    • The physiological sensitivity of the species to 1080 poison (depends on many things principal amongst them the historic exposure of the species to 1080 as it occurs in Australian plants), something that can be experimentally measured.

    • How many baits the species might find (depends on the sensory abilities of the animal, how, where and the number of baits placed in a given area — the landscape density).

    • How many baits the species might eat within a certain period. To cause death, a lethal dose has to be ingested in a certain time — usually within 2 days because sub lethal doses of 1080 are metabolised. Dried meat baits are too hard for many species to do more than mouth and nibble but many species can eat other baits such as Foxoff (eg non toxic bait trials — Belcher 1998 and DPIW data). There is evidence some species can detect 1080 in baits and avoid eating them (eg the spotted-tailed quoll in Foxoff baits, Kortner et al 2003).

    • How much 1080 is left in baits when they are eaten (if they are decomposing, 1080 will have also degraded to a comparable degree).

    • The likelihood of the species digesting baits (many carnivores and omnivores regurgitate food containing significant amounts of 1080. There are past records of devils regurgitating 1080-laced food in captive trials).

    • The age and health of the individual eating the bait or carcasses of poisoned animals (smaller individuals of a species likely have higher metabolisms and consequent usual higher sensitivity to 1080 and healthy individuals likely have more resistance to 1080)

    • The size of individuals in the population at baiting (size effects metabolism and consequent susceptibility to 1080. Individuals of the same species might be different in size in different populations, eg devils on the east coast of Tasmania are much larger than west coast individuals, and there may be many small juveniles just after breeding).

    • How the species’ range and abundance overlaps with 1080 baiting (the proportion of the species that might be exposed to baiting).

    Physiological sensitivity

    The level of physiological sensitivity of a species to 1080 is usually described as the species’ LD50 – that is the mg of 1080 ingested per kg of animal during a very short period that will kill 50% of the individuals exposed (LD = Lethal Dose). Most of the research on LD50s for Australian animals and the potential impacts of 1080 was done on captive animals decades ago by Dr John McIlroy, then at CSIRO, and published in various issues of Australian Wildlife Research (eg McIlroy, 1981a, 1981b and 1981c) and he still gives occasional advice on the matter to DPIW. It is doubtful if this work could ever be substantially expanded or repeated because it involves lethal testing.

    LD50s for some Tasmanian animals of obvious interest as potential non-target consumers of fox baits (mainly dried kangaroo meat but also some Foxoff meat compound) are

    image

    We see that kg-for-kg, red foxes are over 13 times as sensitive to 1080 as are spotted-tailed quolls and 30 times as sensitive as devils. The LD50 for spotted-tailed quolls is lower than might be expected considering those for its relatives, the eastern quoll and Tasmanian devil. McIlroy has expressed the opinion the small sample size and temperatures the results were obtained under may have given a too low result. This is born up by most mainland research that shows little effect of fox and wild dog baiting on spotted-tailed quolls (eg Kortner et al 2003).

    Persistence of 1080 in baits

    In the field, 1080 breaks down by microbe and fungal activity. Meat baits as used in Tasmania are about 120g of fresh kangaroo meat, each dosed with 3mg of 1080 dried hard to about 40g for storage then use (eg Saunders et al 1995). By the time they are set (buried) some 1080 is already broken down and on average they then only contain 2.7mg – a 10% loss. Once buried, degradation of 1080 accelerates, the rate depending on soil conditions (particularly moisture and temperature) and consequent baits degradation. Such degradation of 1080 is well known (eg Saunders et al 2000).

    Tasmanian 1080 fox dried meat baits have been tested after different times in the ground in field conditions and on average after 2 days in the ground only 43.3% of 1080 remained, after 5 days there was 28.2% left, after 10 days 19.7% and after 15 days 11.6%. However, there was considerable variation even between neighbouring baits; some in wet places have much less 1080 residue and some in dry places much more than the average.

    Number of baits needed to put individuals at risk

    Considering the sensitivity of spotted-tailed quolls, devils and foxes to 1080 and degradation of 1080 in buried baits we can calculate how many baits buried for various times need to be eaten by different sized spotted-tailed quolls, devils and foxes within 2 days to have a 50% chance of being killed.

    We see below that a very small spotted-tailed quoll will consume an LD50 if it eats most of one freshly layed bait but that same animal would have to eat at least 5 baits within 2 days once they had been in the ground for two weeks to be at similar risk. Similarly a very large spotted-tailed quoll would have to eat more than 4 freshly layed baits to be at risk but more than 30 after two weeks in the ground.

    image

    We see below that even a very small devil (probably not even weaned) needs to eat more than 3 freshly layed baits within 2 days to reach an LD50 and large devils need to eat very many baits in a short period to reach an LD50.

    image

    We see that foxes are extremely susceptible to 1080 baiting and in many circumstances need less than 1 bait to reach an LD50.

    image

    The chances of individuals finding enough baits in a short enough period to be at risk

    Extensive testing with foxes on mainland Australia clearly shows they can find baits immediately they are buried; initial take is often high and usually continues until baits and/or foxes are greatly reduced (eg Saunders et al 1995). Limited testing with Foxoff and fresh meat baits with captive and wild spotted-tailed quolls in NSW showed they could detect buried baits but trials only identified this species as taking 2 of 7 baits taken after 3-4 weeks buried adjacent to a spotted-tailed latrine in the wild (Belcher 1998); results consistent with Tasmanian observations considering time buried and that baits were replaced exactly where taken (see below).

    Research on take of fox baits without 1080 was undertaken with an isolated, island population of devils (no quolls or foxes present). Initial take was very low (a few % per night) but escalated once baits began to rot, to the point where most baits were taken after 3 weeks. These results were mirrored in places with devils and spotted-tailed quolls, devils and eastern quolls and eastern quolls alone; there are no places exclusively with spotted-tailed quolls in Tasmania. If baits were replaced in a hole where a previous bait had rotted then re-take could be immediate but if placed in a new hole take was very low. Devils in particular would sometimes deeply excavate holes in which baits had rotted.

    It seems devils and quolls are not well equipped to find buried baits until they rot or are otherwise smelly (or replaced); probably there has been no need in their evolution. On the other hand, foxes and dogs evolved under conditions of extremely harsh winters where caching and recovering food (or raiding others’ caches) was fundamental to survival. Therefore, these canids are ‘professionals’ at finding buried food (eg Saunders et al 1995, Twigg et al 2000). This does not mean that other species cannot find any buried baits or might even be exposed accidentally (eg during echidna excavations) but it is a clear trend.

    There has been considerable questioning of what animals have taken the thousands of baits of the nearly 80,000 sofar set in Tasmania. Checking baits daily allows a reasonable judgment of what might have taken them and in the early days of baiting (2002/3) when daily checks were undertaken about 20 baits were recorded as taken in typical fox style (as seen else where in Australia). Once baiting expanded and baits were only checked at recovery such judgments of take could rarely be made; hence the experiments reported here. If baits were recovered 2-3 weeks after burial few were missing but if it was 3 weeks or more most might be – it seemed a simple fact of rotting and then being found.

    In operational fox baiting in Tasmania, baits are buried at a landscape density of 5-10/km2. The number of baits in an animal’s home range can also be considered and how much competition there might be for baits. A large devil might have 100 baits in its home range but that home range would likely be shared by 10-30 other devils plus quolls (and possibly foxes). Thus, the baits available per individual are comparatively few.

    The chances of individuals eating enough baits in a short enough period to be at risk

    Although they can easily eat soft baits, test have shown that small or even medium sized spotted-tailed quolls and very small devils do not (probably can not) eat very dry and hard baits and it is not until they are independent that they are likely to be under enough nutritional pressure and are strong enough to eat such. Tests on captive mainland Australian spotted-tailed quolls support these results (Belcher 2000).

    What actually happens in the field?

    Considerable research has been done on effects of 1080 fox baiting on spotted-tailed quolls on mainland Australia (eg Kortner ET al 2003). In Tasmania, experimental 1080 baiting was not carried out but rather, research waited until an operational baiting occurred in an area with enough spotted-tailed quolls to usefully study (near Wynyard).

    Although there were too few quolls in the study sites area (and a comparative control site with no baiting) to have statistically robust comparisons of numbers before and after baiting we found individual spotted-tailed quolls similarly persisted in both areas through and after baiting. Importantly, there were breeding females (with pouch young) and free ranging juveniles present in both sites after baiting; there was no identifiable difference between baited and non-baited sites. This work will be repeated as opportunity presents.

    In the northern midlands where the effects of 1080 fox baiting on devils was being studied, there was also a ‘background’ population of spotted-tailed quolls. Trapping after a prolonged baiting period showed all elements of a normal devil population in place – breeders and juveniles with no apparent drop in density. Perhaps most interestingly, in the months after this research a substantial drop in numbers of devils due to Devil Facial Tumour Disease occurred and in another 6 months numbers of spotted-tailed quoll seemed to have measurably increased (probably due to decreased competition and predation from the fewer devils) and has stayed high with an apparently normal mix of breeders and juveniles. DFTD it seems has absolutely overwhelming effects (even if indirect) compared to fox baiting.

    In an area in which Foxoff meat compound baits were operationally used extensive capture-mark-recapture studies were done of large local populations of Tasmanian bettongs Bettongia giamardi and brushtail possums Truchosaurus vulpecula, two species likely to eat these baits. Very few Foxoff baits were taken and there was no difference in population change between the baited site and a control site.

    These Tasmanian ‘pilot’ studies suggest there is little if any damage to local populations of spotted-tailed quoll, Tasmanian devils, Tasmanian bettongs or brushtail possum from 1080 fox baiting in Tasmania as is known to have severe effects on fox populations on mainland Australia (eg Saunders et al 1995).

    State-wide Effects

    A final check can be made by looking at what proportion of Tasmania’s spotted-tailed quoll and devil population might be exposed to 1080 fox baiting. Sofar, 1080 fox baiting has only touched the fringe of Tasmania’s core spotted-tailed quoll habitat and perhaps less than 2-3% of Tasmania’s spotted-tailed quolls have been in baited areas. Similarly perhaps 5% of Tasmania’s devils have been in baited areas. These areas and percentages may increase by half with planned fox baiting but, even then the reality is little or no effect on a small proportion of the State’s populations of these important species.

    References

    1. Belcher, C. (1998). Susceptibility of the tiger quoll, Dasyurus maculatus, and the eastern quoll D. viverrinus, to 1080-poisoned baits in control programmes for vertebrate pests in eastern Australia. Wildlife Research 25, 33-40.
    2. Belcher, C. (2000). The ecology of the Tiger Quoll Dasyurus maculatus, in south-eastern Australia. Unpublished PhD thesis, Deakin Uni.
    3. Kortner, G., Gresser, S. and B. Harden (2003). Does fox baiting threaten the spotted-tailed quoll, Dasyurus maculatus? Wildlife Research 30, 111-118.
    4. McIlroy, J. C. (1981a). The sensitivity of Australian mammals to 1080 poison. 1. Intraspecific variation and factors effecting acute toxicity. Australian Wildlife Research 8, 369-383.
    5. McIlroy, J. C. (1981b). The sensitivity of Australian mammals to 1080 poison. 11. Marsupial and eutherian carnivores. Australian Wildlife Research 8, 385-399.
    6. McIlroy, J.C. (1981). The sensitivity of Australian animals to 1080 poison.1X. Comparisons between the major groups of animals, and the potential danger non-target species face from 1080 poisoning campaigns. Australian wildlife Research 13, 39-48.
    7. Saunders, G., McLeod, S. and B. Kay (2000). Degradation of sodium monoflouroacetate (1080) in buried fox baits. Wildlife Research 27, 129-135.
    8. Twigg, L., Eldridge, S., Edwards, G., Shakeshaft, B., dePeru, N. and N. Adams (2000). The longevity and efficacy of 1080 meat baits used for dingo control in central Australia). Wildlife Research 27, 473-481.

    Other Useful Reading

    Kinnear, J.E. (2003). Eradicating the fox in Tasmania: A review of the Fox Free Tasmania Program. Unpublished report to DPIWE, Hobart.
    Saunders, G., Coman, B., Kinnear, J. and M. Braysher (1995). Managing vertebrate pests: Foxes. Australian Government Printing Service, Canberra
    Saunders, G., Lane, C., Harris, S. and C. Dickman (2006). Foxes in Tasmania: A Report on the Incursion of an Invasive Species. IACRC, Canberra.

    Nick Mooney is a wildlife biologist with DPIW and has been working with Tasmanian wildlife for more than 30 years. Amongst other hats, he pioneered Tasmanian rehabilitation and conservation of raptors including eagles in forestry, has monitored reports of Thylacines and foxes, helped with responses to newly discovered diseases, whale strandings and oil spills and developed practical conservation of devils and innovative wildlife tourism. Most recently he kicked off the response to Devil facial Tumour Disease and has been giving advice for the response to recent evidence of foxes in Tasmania. Nick is assessing the potential ecological effects of DFTD, foxes and cats; he sees the biggest ecological threat as establishment of foxes because of DFTD, a process that could cause the ultimate long term threat to devils (his favourite animal).

    Nick Mooney

    There has been a recent spate of public concern over the effect that 1080 baiting targeting the red fox Vulpes vulpes in Tasmania might have on the spotted-tailed quoll Dasyurus maculatus and the Tasmanian devil Sarcophilus harrisii.

    Considerable research has been done on that quoll species on mainland Australia, studies augmented by work in Tasmania on both it and devils.


    Foxes, quolls, devils and 1080 #2

    [This article is extracted from the Tasmanian Times, 27-Nov-2006, by David Obendorf,^ http://tasmaniantimes.com/index.php?/article/obis1/].

    AS NICK MOONEY states: ‘Most of the research on lethal dose to 50% (LD50) for Australian animals and the potential impacts of 1080 was done on captive animals decades ago by John McIlroy, then at CSIRO, and published in various issues of Australian Wildlife Research. It is doubtful if this work could ever be substantially expanded or repeated because it involves lethal testing.’  (Foxes, quolls, devils and 1080)

    With DPIW poised to embark on a decade-long $56 million dollar fox eradication campaign using 1080 meat baits as the principle eradication tool, I believe there are several very good reasons why 1080 testing of non-target Tasmanian species exposed to these baits must now be repeated. For Tasmanian wildlife authorities to rely solely on this unrepeated toxicological data would be reckless.
    John McIlroy commenced his work on the sensitivity of Australian animals to the poison 1080 (Sodium Fluoroacetate) a quarter of a century ago. John was a research scientist working at the CSIRO Division of Wildlife Research at Gunghalin near Canberra. During the period from 1980-86 he conducted a series of dose-response experiments to assess the sensitivity of 1080 on a representative range of Australian animals, covering species in all the main vertebrate taxa. He published 9 scientific papers in this series; 7 as the sole author and 2 in collaboration with others.

    In documenting his research findings, John was careful to firstly prepare the theoretical and statistical ground work on which this series of experimentally-based toxicity would be based (McIlroy 1981a).

    “In toxicological work the sensitivity of different [species of] animals to a poison is usually expressed as the LD50 or median lethal dose, a statistical estimate of the dose — in milligrams of poison per kilogram body weight, that will kill 50%  of a large population.

    The LD50 of a poison and its 95% confidence limits are only an indication of the values that might be expected from repeated trials on the same strain of animals under the same experimental conditions.”

    In applying the LD50 values to a test poison, McIlroy states:

    “The necessity for such a standardised procedure has been questioned … [as] statistically significant differences in LD50 values (up to 3.2 fold) within and between laboratories, related to differences in experimental procedure, …  [but] these were not great enough to change the interpretation of the relative hazards of the test chemical involved. However, because I was concerned with a controversial poison [1080] and its toxicity to a variety of wild animals, I felt it was important to assess the effects that differences in experimental procedure might have on LD50 values of 1080 and, if necessary, design a procedure to minimize such sources of variation.” (McIlroy 1981a)

    In his second paper detailing the results of his experimental studies on marsupials and placental mammals, John began on a cautionary note:

    “The effect that these [1080] poisoning campaigns are having on non-target or native animal populations is not known, despite occasional reports of individuals of these species being found dead or ‘vanishing’ from areas in which 1080 has been used.” (McIlroy 1981b).

    Targeting dingoes

    McIlroy was very considered in any reliance of these experimentally derived LD50 values:

    “In reality many factors are involved in determining whether an individual or what proportion of a population may be killed by a [1080] poisoning campaign. The preceding theoretical analysis involved mean body weights of only small samples of animals, LD50s obtained under specific experimental conditions, and a particular concentration of 1080 in each bait plus the assumptions about bait intake by free-living species. All are likely to vary in different field situations, altering the risk each individual carnivore faces.”

    Based on 1080 baiting campaigns targeting dingoes (& wild dogs), John McIlroy made some thoughtful recommendations when deciding on the most effective bait size and quantity of 1080 per bait for maximal kill of target species and minimal impact to non-target (native) species.

    “The data on [1080] sensitivities do provide fundamental information for the planning of dingo-poisoning operations. For example, if the aim is to obtain maximal control with minimum dose it would be best to plan the baiting on the basis of a LD100 based on twice the upper confidence limit of the LD50 and the weight of the heaviest specimen reported. In contrast, to assess the hazard to a non-target species, calculations might be best based on the lower confidence limit of the LD50, or some other lower figure, and either the mean weight or much lower body weights of, for instance, immature animals.”

    McIlroy went on to do a theoretical calculation to show this point for dingoes (the target carnivore) and spotted-tail quolls (a non-target carnivore).

    “The heaviest individual [dingo] caught in the Eastern Highlands was 25 kg. Thus if the LD100 is assumed to be approximately twice the upper confidence limit of the LD50 (i.e. 0.3mg/kg BW), it would be necessary to get 7.5 mg of 1080 into a dog of this size to kill it. Similar calculations for tiger cats [spotted-tail quolls], using twice the lower confidence limit of the LD50 (i.e. 2.56 mg/kg BW) and taking the mean body weight of 2.8 kg, indicate that 7.17 mg of 1080 is a lethal dose for [this species].

    Applying McIlroy’s precautionary recommendation to the mean body weight for immature spotted-tail quolls of 1.1 kg, only 2.8 mg of 1080 is a lethal dose.

    Obtain a lethal dose

    The same theoretical calculation and logic can be applied can be applied to 1080 poisoning campaigns targeting foxes.

    For an extreme body weight fox of 6 kg and applying an LD100 that is approximately twice the upper confidence limit of the LD50 (i.e. 0.26mg/kg BW), it would be necessary to get a fox to consume 1.56 mg of 1080 to kill it (not 3 mg of 1080 per bait). If each dried kangaroo meat (DKM) baits contained this amount of 1080, one bait would kill all foxes less than 6 kg. When applying McIlroy’s precautionary calculation to a mean body weight for immature quolls, such animals would need to ingest at least two baits to obtain a lethal dose.

    “From the viewpoint of trying to safeguard tiger cats [spotted-tail quolls]; therefore, it is obviously necessary to keep 1080 concentration in baits as low as possible.” (McIlroy 1981b)

    One variable that McIlroy particularly commented on was the effect of ambient temperature on the sensitivity of 1080 poison. He was concerned that his experimental trials to set the LD50 for many native marsupials were carried out at about 22°C (in controlled environment rooms). He noted that in relation toxicity studies on the spotted-tail quolls, trials were conducted at 13°C where the LD50 was calculated at 1.85 mg/kg BW.

    “… different ambient temperatures cause two to five fold differences in the susceptibility of mice and guinea pigs to 1080. Both species are susceptible at both low and high ambient temperatures than they are at medium temperatures. If similar responses occur amongst other, larger homeotherms, this might explain the relatively low LD50 for the tiger cat [spotted-tail quoll] compared to those for the other native cats [quolls]. The possibility exists, therefore, that if these trials had been carried out at 22°C [instead of 13°C], the LD50 would have been slightly higher than 1.85 mg/kg BW.

    Ambient temperatures obviously vary considerably between field poisoning situations, both geographically and diurnally, so a LD50 obtained at 22°C, or a dose that will kill 50% of a population experiencing this ambient temperature, must be regarded as only a general value. Greater population mortality may be expected at much lower or higher environmental temperatures.” (McIlroy 1981b)

    In relation to the most susceptible non-target marsupial carnivore, the spotted-tail quoll, 1080 baiting programs targeting foxes and wild dogs are still reliant on McIlroy’s highly qualified toxicology studies and LD50 calculations.

    In obtaining his LD50 levels for each species, McIlroy orally dosed between 3 and 5 individuals at dose intervals of 1.26 in 4 distinct dose groupings. For spotted-tailed quoll he used 12 animals. The LD50 was calculated at 1.85 mg/kgm with 95% confidence intervals of 1.28 to 2.68 mg/kgm BW.

    Other animals begin to vomit

    Clinical observations were made on the experimentally poisoned animals.

    “Most commonly, affected animals suddenly became hyper-excited, with rapid breathing, bouts of trembling and sometimes periodic circling within their cages. Again, some animals may then recover while other begin to vomit, convulse, or both. With some animals, particularly the eastern native and tiger cats [quolls] and Tasmanian devils, the first symptom is the sudden onset of vomiting.

    Convulsions were triggered by disturbance, such as the opening of a door, sudden movement by an observer, or convulsion by a neighbouring animal. In rough order, these symptoms include: restlessness; increased hyperexcitability or response to stimuli; bouts of trembling; rapid, shallow breathing; incontinence[involuntary passing of urine and/or faeces] or diarrhoea; excessive salivation; twitching of the facial muscles; nystagmus (involuntary eyeball movement exposing the whites of the eyes)or bulging eyes with large (dilated) pupils and rapid blinking plus, in domestic cats, discharge of mucus from the eyes); slight lack of coordination or balance; abrupt bouts of vocalisation; and finally, sudden burst of violent activity such as racing around the cage, or biting the cage mesh or other objects. All affected animals then fall to the ground in a tetanic seizure, with hind limbs or all four limbs and sometimes the tail extended rigidly from their arched bodies. At other times the front feet are clasped together, clenched or used to scratch frantically at the cage walls. This tonic phase is then followed by a clonic phase in which the animals lie and kick and ‘paddle’ with the front legs and sometimes squeal, crawl around or bite at objects. During this phase the tongue and penis may be extruded, the eyes rolled back so that only the whites show and the teeth are ground together. Breathing is rapid but laboured, with some animals partly choking on their saliva. Finally such animals begin to relax, breathing more slowly and shallowly and lying quietly with the hind legs still extended but apparently semiparalysed (paresis).

    From then on individual animals either: (1) gradually recover; (2) die shortly afterwards; (3) after a short or long delay (e.g. 5 min or 3-4 h) experience another one or two series of convulsions and then die shortly afterwards or eventually recover; (4) remain lying quietly, scarcely breathing or moving, until death up to 6 days later.

    It is noteworthy that in McIlroy’s observations on carnivorous marsupials exposed to sub-lethal doses of 1080, he noted that animals that did not die but ‘remained weak for 2 or more days’. From this we can infer that the sub-lethal consequences of 1080 poisoning may therefore affect an animal’s ability to evade predation by other animals and affect their ability to find safe refuge.

    McIlroy also makes the following observations:

    “The pouch young of tammar wallabies are significantly more susceptible to 1080 than adults (P>0.01. The pouch young of brush-tailed possums and northern native cats, Dasyurus hallicatus, similarly appear to be more sensitive than adults. More pouch young pouch young possums than adults died at each dose level, although only their mothers were dosed with 1080; presumably the young ingested lethal amounts of 1080 in the milk. The eight pouch young of one northern native cat also died within 24 h after their mother received a non-lethal dose (84% of a LD50 )but the five pouch young of a tiger cat, Dasyurus maculatus, survived in similar circumstances (74% of a LD50 ). [There are] similar reports of young rats killed by milk from their poisoned mothers.” (McIlroy 1981).

    Fox entry into Tasmania

    Fox entry into Tasmania has ALWAYS been a biosecurity/biodiversity risk for Tasmania, yet it is remains unclear whether foxes have established breeding populations in Tasmania.

    Despite the unsubstantiated stories of intentional introductions of foxes the most likely source of single-fox introductions into Tasmania has been slack and inadequate quarantine measures. In the decades of inadequate quarantine measures at our ports, any foxes that have arrived and escaped into Tasmania, the questions remains which locations have the highest frequency of receiving fox-risk materials?  Might these be the places where foxes might just get lucky and breed?

    Over fifty years of 1080 use in Tasmania to control native herbivores like Bennett’s wallaby, Tasmanian pademelon and brush-tail possum coupled with the high sensitivity of red foxes to secondary 1080 poisoning (i.e. through eating a poisoned carcass) is rarely acknowledged.

    Where will they ‘get lucky’ in the landscape? Closest to the farms & feedlots that have historically received container-loads of stock feed grain; agri-businesses that transport or deal with used farm equipment; freight forwarding depots. The highly reliable sighting reports of foxes in remote areas (where 1080 poisons have not been used) like the western Central Plateau or our National Parks must be the basis for intensive investigation. Maybe the remote camera used by the DFT team can be now deployed for fox studies.

    It ALWAYS comes down to validating the risk assessment.

    References:

    1. McIlroy, JC (1981) The Sensitivity of Australian Animals to 1080 Poison I. Intraspecific variation and Factors affecting Acute Toxicity. Australian Wildlife Research 8, 369-383.
    2. McIlroy, JC (1981) The Sensitivity of Australian Animals to 1080 Poison II. Marsupial and Eutherian Carnivores. Australian Wildlife Research 8, 385-399.


    David Obendorf

    With DPIW poised to embark on a decade-long $56 million dollar fox eradication campaign using 1080 meat baits as the principle eradication tool, I believe there are several very good reasons why 1080 testing of non-target Tasmanian species exposed to these baits must now be repeated. For Tasmanian wildlife authorities to rely solely on this unrepeated toxicological data would be reckless.


    © The Habitat Advocate    Public Domain

    error: Content is copyright protected !!